In 2025, the Indian mobile app development industry will have significantly evolved. The $25 billion industry is home to hundreds of thousands of developers, scattered across hundreds of companies. But the range is still enormous: Choosing a top partner rather than a middling developer could mean millions of dollars in lost income, launches pushed back, and technical debt.
The problem app leaders face is not determining which mobile development firms to approach (there are thousands), but which ones are truly outstanding. Statements like “200+ successful apps developed” or “expert developers” do not provide any clarity on the quality standards they follow. The real differentiators are far more specific, yet quantifiable.
This is a guide to the 12 tangible signals that separate leading mobile app development companies in India from the average ones. These are not subjective attributes such as “good communication” or “experienced team.” They are tangible factors and metrics that have a direct influence on an app’s success, its user retention, and even business success.
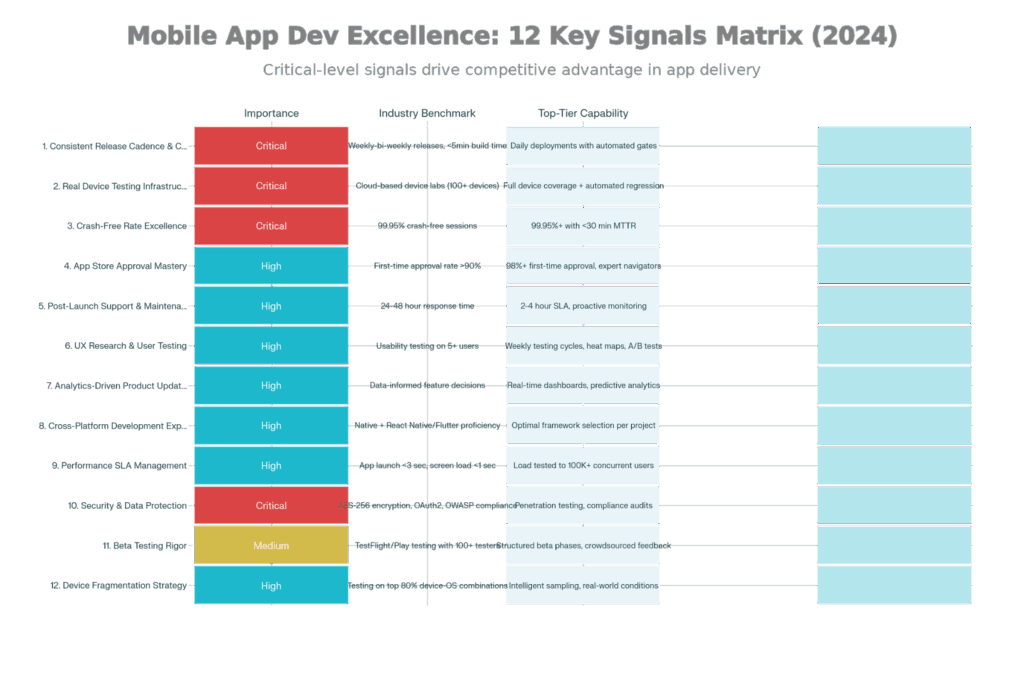
12 Crucial Indicators of Elite Mobile App Development Firms: Characteristics & Standards
Before getting into specific signals, be aware that top-tier companies don’t only execute well in one or two of these domains—they are disciplined in all twelve. A company with world-class UX research and bad CI/CD will still ship in an unreliable manner. On the other hand, high-quality code delivered without post-launch support is left as a problem for you to solve.
The signals create a system. Testing on real devices avoids compatibility issues that can be identified by monitoring crash rates. Mastery of app store approval is gained by knowing which rules the proper testing will find violations of. Post-launch support infrastructure is needed to support analytics-driven updates safely. These aren’t separate functions—they are the day-to-day operations of a great mobile app.
The pace at which a company releases updates is a direct indicator of how evolved its development processes are. Organizations with broken, manual CI/CD pipelines take weeks to ship features; elite organizations ship multiple times weekly.
Top-tier mobile app developers have made large investments in CI and CD infrastructure. This translates to concrete capabilities:
Automated Build Processes: Each code commit results in an automatic compilation to native binaries (iOS .ipa files, Android .apk files) with no human intervention. The build completes in under 5 minutes for top-tier companies, compared to 20-30 minutes for average organizations.
Continuous Testing Gates: You can’t merge code that doesn’t pass the automated test suite. Unit tests running in under 2 minutes, in 5 minutes integration tests – coverage, so the tests are highly readable, and can be helpful. If it passes all the gates, then it is production-ready by design.
Release Frequency: Top-tier organizations release 5 to 7 times per week (some daily), or more, compared to “vanilla” organizations releasing on a monthly basis. Because they deploy so often, each change is tiny, and tiny changes are less risky and have rapid feedback cycles. When users ask for a feature on Tuesday, it ships Friday—not next quarter.
Feature Toggles & Canary Deployments: New features can be turned off via feature toggles without redeploying. Releases to production are staggered: first 1% of users, then 5%, then 100%, monitored at each stage to identify issues before affecting a broad audience.
Automated Load Performance Testing: Load Testing is performed automatically before each release to ensure the App can handle realistic traffic. Top-tier companies hit the scale: 100,000 concurrent users, 10,000 API requests per second.
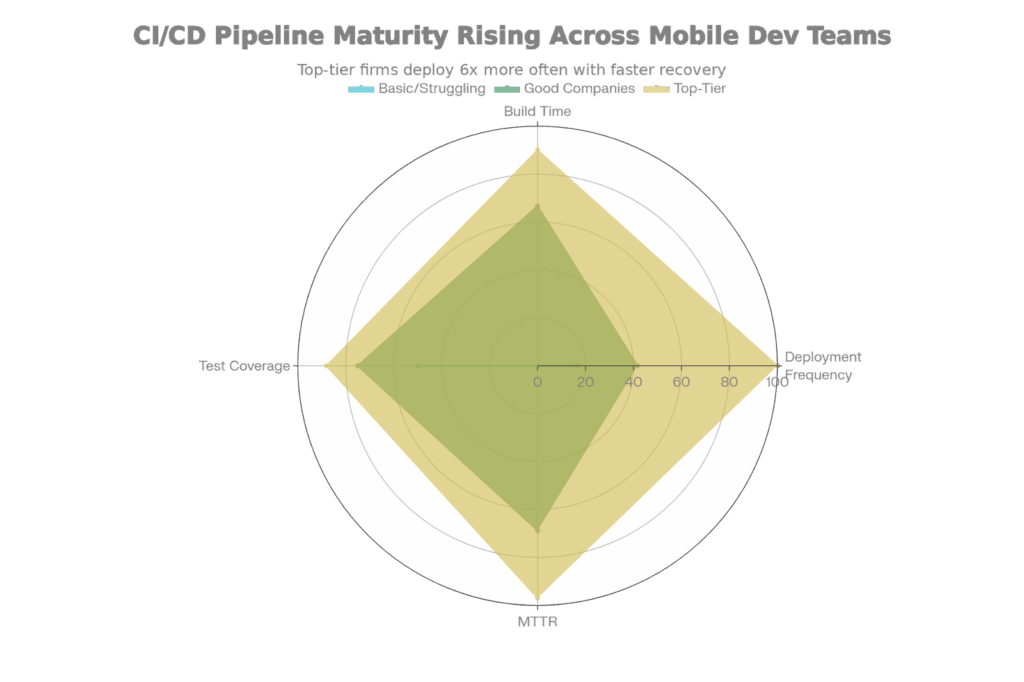
Mobile App CI/CD Maturity: Deploy Frequency vs. Build Efficiency vs. Time to Recover
The practical impact: A bug found Friday afternoon in the app of a top-tier company is fixed, pushed out to users by Saturday morning through TestFlight or Google Play. That same bug in a basic company pipeline needs to be manually tested, go through approval meetings, and be coordinated for release — maybe a week later on Wednesday.
Ask the company: “What is your average deployment frequency and build time?” Best-tier responses: “We deploy 5+ times weekly; the build time is an average of 3-4 minutes.” Basic company answers: “We release monthly after QA sign-off; the builds take 20+ minutes.”
Request to watch their CI/CD dashboard (Jenkins, GitLabCI, GitHub Actions, Azure Pipelines), top-tier companies show off their pipelines—visible deployment history, green build status, automated testing results. This transparency smacks of hubris, but it is reassuring. This openness makes me think there’s confidence in their process.
Testing only on emulators/simulators overlooks 30-40% of bugs in the wild. Only the results on real devices can show the true performance, network usage, OS behavior, and/or hardware limitations. Leading companies run their tests on hundreds of real devices – not emulators.
Real device clouds have transformed mobile testing – no more costly, on-premise device labs. Top-tier companies subscribe to Sauce Labs, BrowserStack, or LambdaTest and maintain access to:Top-tier companies subscribe to Sauce Labs, BrowserStack, or LambdaTest and retain access to:
Thousands of Real Devices: Not emulators (software simulators that emulate behavior)—actual iPhone and Android phones, tablets, and wearables. BrowserStack provides 5,000+ real devices; Sauce Labs has a similar scale.
iOS Device Coverage: Various iPhone models (iPhone 12, 13, 14, 15) running different iOS versions (iOS 16, 17, 18), iPad models, and Apple Watch. Every combination is slightly different, so the top-tier testing covers 80% of the devices used by target users.
Android Device Coverage: Much more difficult because of device fragmentation. Hundreds of device models (Samsung Galaxy, Google Pixel, OnePlus, Xiaomi, realme) and dozens of Android versions (Android 10 to 15). Manufacturers are also adding their own UI (Samsung One UI, Google Material You, etc. emulators can’t account for those variables.
Automated Test Execution: Top-tier companies run automated test scripts (Appium, Espresso, XCUITest frameworks) covering 50-100 devices simultaneously, as they don’t want to spend time manually launching apps on dozens of devices. A test that would take 8 hours manually completes in 30 minutes on real device clouds.
Network Condition Simulation: Real-device clouds simulate real network conditions – 4G, 5G, poor connectivity, network handoff (disconnecting WiFi mid-session and reconnecting via cellular). This exposes invisible performance issues that would not appear in the laboratory.
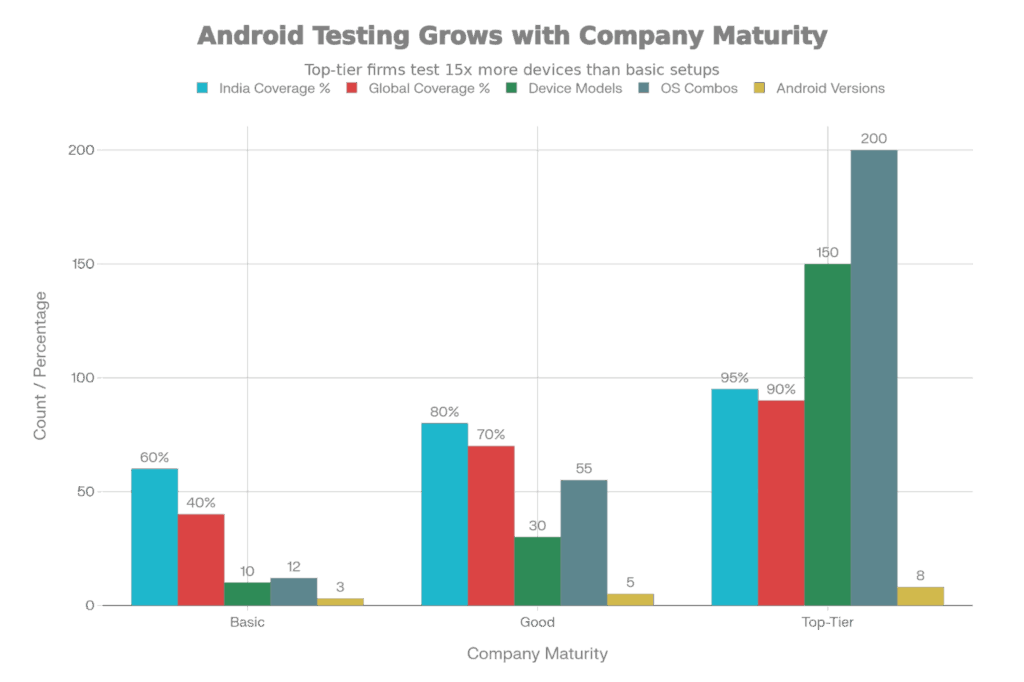
Device Fragmentation Plan: Test Coverage from Entry Level to High-End
Ask “How do you test app compatibility on different devices?” Top-tier answers include tool names (Sauce Labs, BrowserStack), the number of devices (100+), and automation frameworks being used. Basic responses include: “We test on a handful of Android devices that we keep in the office” or “We use the iOS Simulator.”
Ask to see screenshots of their reports from tests run on cloud testing services. Tier-one firms monitor crash rates specific to a device, OS version distribution of failures, as well as the concentrated bug-ridden devices.
A single crash is enough to frustrate users. Multiple crashes result in uninstalls. Apps that have 99.95% crash-free sessions get 4.5+ star ratings; ones that fall under 99.85% CFS see negative reviews and churn.
Crash-free rates are calculated in two related ways:
Crash-Free Users (CFU): The portion of individual users who did not encounter a crash within a given timeframe. If 1,000 people opened your app and 990 never crashed, CFU = 99%. This measure hides users who crash repeatedly (ASVU users).
Crash-Free Sessions (CFS): Percentage of user sessions (app launches) that ended without a crash before the session was terminated. You had an app that was opened 10,000 times and crashed 50 times, CFS = 99.5%. This metric is more stringent as long-time users will realize the benefits of stability immediately, but not vice versa.
The bar has been raised for the 2025 industry best practice:
The change from 99.85% to 99.95% looks trivial (it’s a difference of 0.1 percentage points), but it actually equates to a 10x increase in reliability.
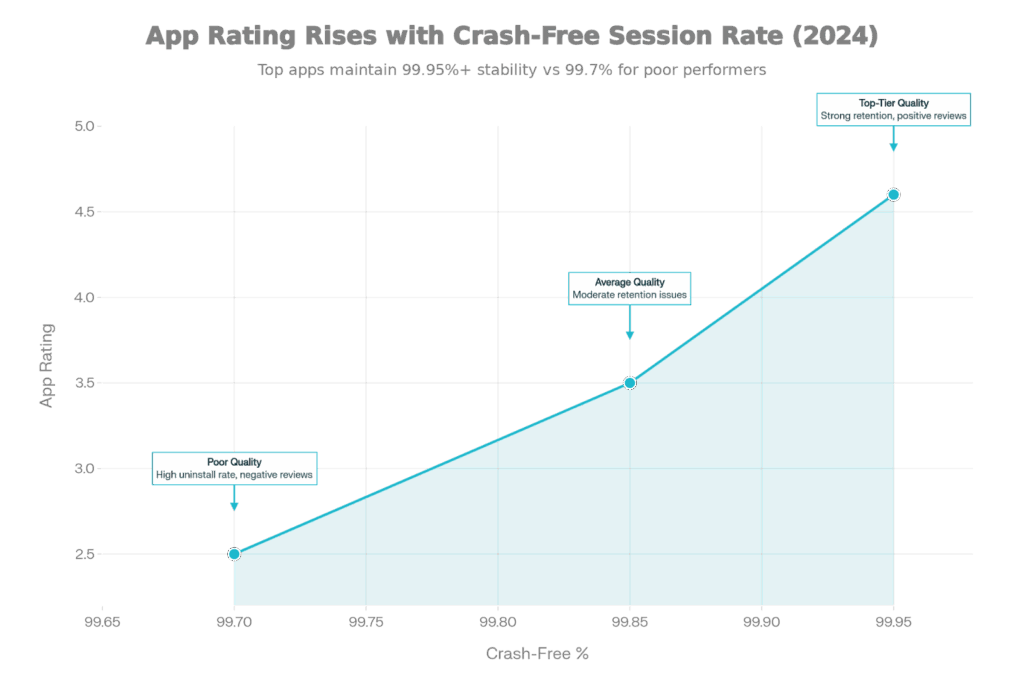
App Store Rating vs. Crash-Free Session Rate: The 2025 Stability-Rating Association
Studies indicate a strong relationship between crash-free rate and app store ratings:
4.5+ Stars: Apps in this tier have 99.85%+ CFS. The user can believe in the app – crashes are not something you expect, not something that happens regularly.
3.0-4.0 Stars: Apps swap in and out in this range between 99.7-99.85% CFS. Users seem to have mixed feelings as crashes are intermittent. Some people love the app but say it has stability problems.
Below 3.0 Stars: Apps drop to 99.7% CFS and lower. Crashes are so common that users take them for granted. Negative reviews talk about “constantly crashing” or “uninstalled it after the third crash.”
What Causes Crashes (and How the Best Companies Avoid Them):
Code Bugs (40 percent of crashes): Null pointer exceptions, array index out of bounds errors, and invalid logic. Top-tier companies rely on strict typing (Swift for iOS, Kotlin for Android) that catches many bugs at compile time, and also have comprehensive unit testing (80%+ code coverage).
Out of Memory (OOM) crashes (20 percent): Apps ask for more memory than devices have. Leading companies do load testing on low-RAM devices (3GB RAM is standard in India), track memory usage in production, and optimize image handling.
Third-party SDK problems (15 percent): Firebase, Crashlytics, advertising SDKs, and payment processors may bring in bugs. Top-tier companies review SDK thoroughly, keep dependencies up to date, and have fallback options.
OS incompatibility (15 percent): New Android/iOS versions bring breaking changes. Apps relying on deprecated APIs crash on new OS releases. Top-tier companies watch pre -OS releases (beta testing), SDK updates proactively.
Network errors (10 percent): Apps look at the network as given, and break when they don’t reach for suite point. Leading companies add offline-first logic, graceful degradation.
Ask: “What’s your usual crash-free session percentage?” Top-tier: “We keep 99.95%+; last month it was 99.96%.” Medium: “About 99.8-99.9%. ” Bad: “We monitor crashes in Crashlytics but haven’t done any optimization—probably 99% or something.”
Request for access to Crashlytics or Firebase Crashes dashboard. The best companies will have a flat dashboard with <100 crash occurrences per 10k sessions, and stable trends over time.
Apps that are rejected don’t make it to users. Add 3-7 days of rejection to the launch. For time-sensitive launches (holidays, promotions, competitive response), delays in rejection can cost you millions.
Apple and Google both have to review apps before they are public:
iOS App Store: 24-48 hour review duration. Apple reviewers test apps manually against 4+ pages of guidelines (functionality, design, content, legal, privacy, etc). Rejection begins a long revision-re-submission process.
Google Play: 2-24 hours of review, usually quicker than Apple because of less manual review. But apps can be taken down after they are launched if they are found to violate policies.
Typical Grounds for Rejection (and How Leading Companies Avoid Them):
UX/Design Problems (25% of rejections): The app crashes on launch, buttons are misaligned, text overlaps, or there’s a poor visual hierarchy. Apple is insistent that “apps must just work.” Leading companies will test designs on 3-5 actual devices (small phone, large phone, tablet) before submission.
Oversights of Privacy Policies (20% of rejections): The app collects location, contacts, or health information, but doesn’t disclose what is done with that data. Apple mandates clear privacy policies and appropriate permissions modalities. Top-tier companies write privacy policies in advance of development and adhere to data minimization principles.
False Metadata (15% of refusals): The description or screenshots of the application exaggerate the functions. The best-in-class companies make screenshots that correspond 1:1 with actual app features, and they never use superlatives.
Excessive Permissions (15% of refusal): App asks for access to the camera but does not need it. Apple/Google incentivize minimal permissions. Tier-one companies only ask for the permissions you need to make the app function.
Policy Violation (10% of rejections): Private API usage, misleading app icons, and aggressive in-app advertisements. Top-tier companies are known to exercise guideline checklists – or better yet, these are built into solutions by default.
Broken Functionality (10% of rejections): Identity features aren’t working. Premier companies create a review account, test critical flows before submission, and thus test critical workflows.
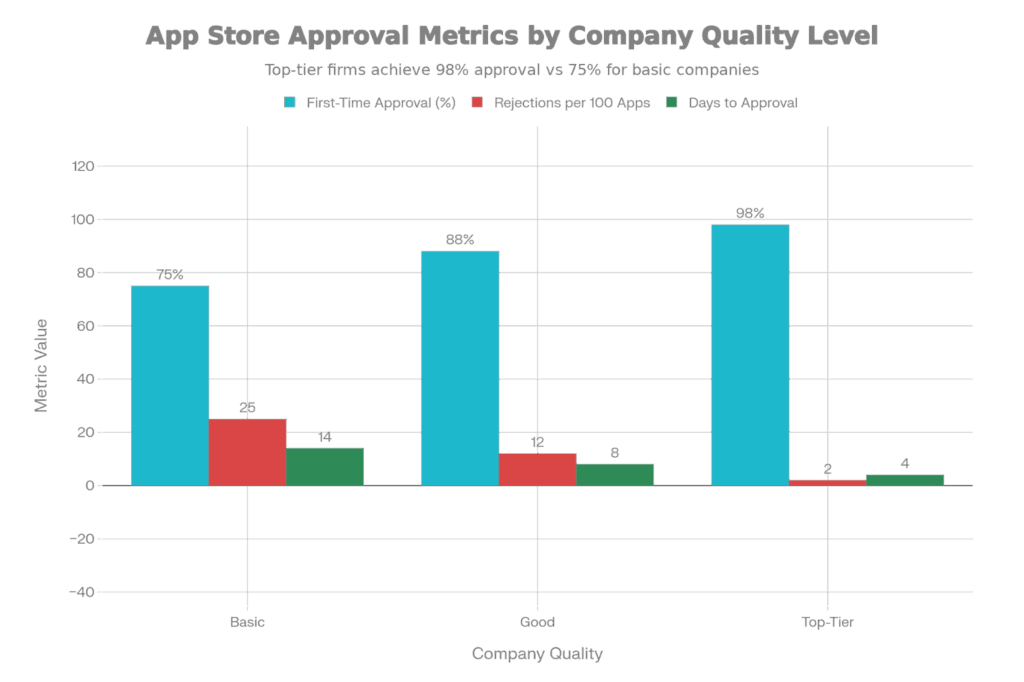
Success Rate for App Store Approval: Initial Approval Rates by Business Maturity
Comprehensive Compliance Checklist: Companies verify 50+ items before submitting: legal (terms of service, privacy policy, copyright claims), content (no offensive material, child safety), functionality (demo accounts ready, test data prepared), design (text size readable, colors accessible), and guidelines (no private APIs, proper deep linking).
Beta Testing: Apps are TestFlight (iOS)/Google Play Beta tested with 100+ real testers for 2-3 weeks before submission. Testers find bugs in the wild. Occasionally, app reviewers will share these concerns with a developer, staving off rejection when the app is officially submitted.
Designer Involvement: Applications submitted by companies with in-house design teams are typically 10-15% more likely to be approved on the first submission, as these designs are natively compliant with platform-specific guidelines (iOS HIG, Material Design for Android).
Legal Review: Apps in sensitive areas( financial, health, kids’ content) will be reviewed by legal before submitting. Privacy policies are specific, not boilerplate.
Review Communication: When apps are rejected, A-level developers respond within 24 hours, well aware of exactly what changed, and resubmit the revised version promptly. To be fair, Apple sometimes has a backlog—waiting a week to resubmit isn’t the developer’s fault, but quick reaction counts.
Ask: “What’s your success rate for getting apps approved in the app store?” Best: “98%+ on first time approval across all projects; latest 5 apps were approved on 1st submission.” Medium: “About 85-90%; we usually get a small rejection, which means a quick-fix.” Bad: “We have had apps rejected multiple times; you just have to go with the flow.”
Apps don’t get better by magic after they launch. Competitors launch features, OS updates bring bugs, and users report the app lacks functionality. Companies that provide universal support for their apps after launch hold on to 25-40% more of their users than those that abandon them after launch.
Apps are launched into a dynamic environment:
Best-in-class companies consider post-launch as a separate phase with its own support team, and not as an afterthought.
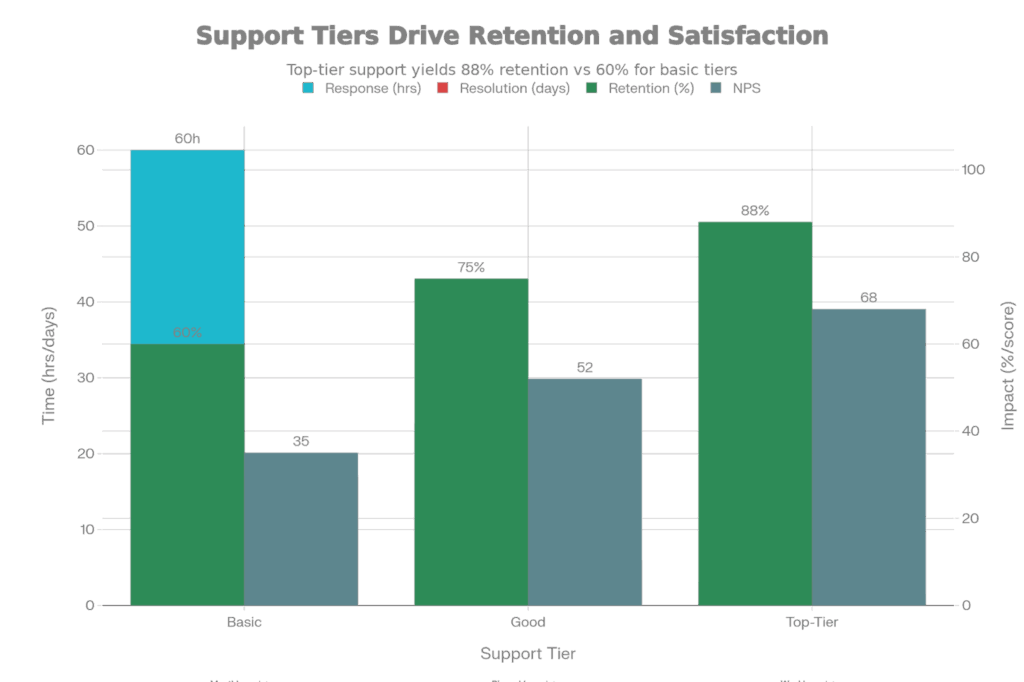
Post-Launch Support SLA: Company Tier-specific Response Time and Resolution Speed
24/7 Proactive Monitoring: The systems are continuously monitored for crash rates, API performance, user engagement, and metrics. Alerts are automatically triggered when these metrics cross thresholds. A crash spike in the morning is investigated urgently, not user complaints.
2-4 Hour Response SLA for Critical Issues: If a critical bug (app crashes on launch, payments fail) is reported by users, the best companies have engineers on call and responding within 2-4 hours. A production hotfix ships that day.
Major Bugs Fix in 24-48 Hours: Critical bugs are fixed and released (via TestFlight/Play Beta) in 1-2 days. Users do not wait weeks for fixes.
Bug Triage is Structured: When problems come in, they’re immediately sorted into categories: Critical (app-breaking, >1% of users), Major (core functionality broken, <1% of users), Minor (edge cases, cosmetic issues). Critical/Major issues get moved to the sprint; Minor issues are queued into the backlog.
Speed of Security Patching: Security issues are patched and released within 24-48 hours. Vendors keep an eye on CVEs (common vulnerabilities and exposures) and proactively update dependencies.
OS Compatibility Updates: When iOS 18 and Android 16 ship, the best companies have been testing for days, have discovered incompatibilities, and have shipped fixes within 1-2 weeks.
Maintenance Plans: Continued support is specified in advance. Top-Shelf companies don’t say “we’ll support your app if you need it,” they specify monthly maintenance hours (10-20 hours), response time SLAs, and escalation paths.
Analytics-Driven Insights: Monthly reports illustrate feature usage, crash patterns, user retention funnels, and provide recommendations for the next set of features.
Query: “What’s included after app launch?” Top-tier: ”We deliver 24×7 monitoring with 2-4 hour response to critical issues, 1-2 day resolution SLA, monthly maintenance hours, and quarterly improvement recommendations based on analytics.” Average: “We’ll help you with bug fixes for 3 months after the launch, at an hourly rate.” Terrible: “Release is when our work is done; you’re on your own after that.”
Applications developed without an understanding of real users tend to crash and burn (much like due to poor usability). Companies that spend money on user studies and usability testing have 30% better engagement and retention.
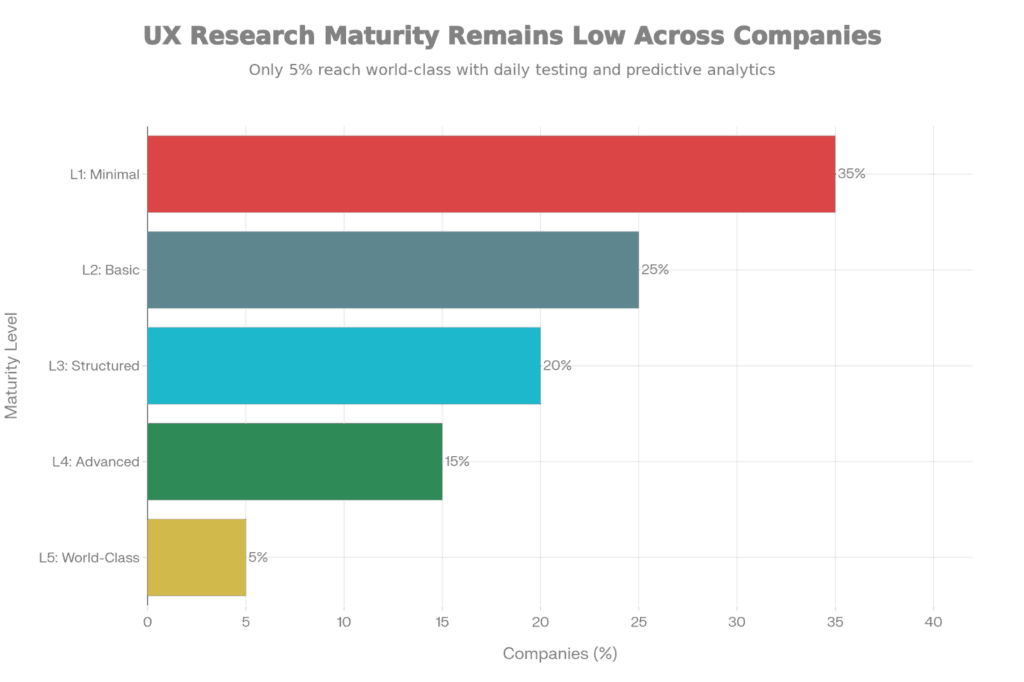
Five Stages of Mobile App UX Research Maturity: From Minimal to World-Class
UX research is anywhere from non-existent (no testing) to outstanding (ongoing improvement):
Level 1 (Minimal): No user testing. Designers make up flows based on assumptions. Apps frequently have perplexing navigation, vague onboarding, and obstacles in critical paths.
Level 2 (Basic): Quarterly surveys and occasional user interviews. Limited feedback, non-continuous cycles of testing, and discoveries are not systemically leveraged.
Level 3 (Structured): 5-8 real users, monthly usability tests, frequent A/B tests, documented design system. Regular testing finds blatant issues before launch.
Level 4 (Advanced): Weekly usability testing, heat maps of where users tap, session recordings to pinpoint their frustrations, and analytics integration to indicate feature usage. Iteration is rapid and data-informed.
Level 5 (World-Class): Test and iterate daily, predict analytics to inform on users who will likely churn, use behavioral science to inform design, always optimizing. Only 5% of companies get there.
Usability Testing: 5-10 users target are tested versions of all major features before launch. Users are given realistic tasks (“You want to send money to your friend”—not “Try sending money”) and are observed as they complete them. Confusion is noted by moderators, and designers iterate based on findings.
Heat Maps & Session Recordings: Platforms such as UXCam or Glue allow tracking where and how long users tap, and how far they scroll down a page. Session density recordings reveal real users’ behaviors under real circumstances, uncovering pain points that UX designers fail to see.
A/B Testing: Several variants of screens (two different button layouts, two different wordings) are presented to portions of the user base. Metrics (conversion rate, session time, task success) are used to decide which version users prefer.
User Interviews: Interviews (regular, monthly) with target users are indicative of unmet needs, missing functionality, and the way users actually use an app (not the way designers think they do use it).
Accessibility Testing: Real users with disabilities (color blindness, hearing impairment, motor limitations, visual impairment) test the apps. Leading companies make WCAG 2.1 AA compliance a core part of their digital strategy, not just a legal requirement, but one that delivers true usability and accessibility to customers.
Ask: How do you validate UX pre- and post-launch? Top-tier: “We have real user usability testing weekly, have heat maps and session recordings in prod, do continuous A/B testing, and iterate on user behavior data.” Average: “We test with our internal team and maybe gather user feedback after launch.” Poor: “Our designers are the most knowledgeable in the industry; we trust their expertise.”
Features that look great on an internal demo often surprise and disappoint in the hands of users. Companies that base feature priorities on analytics (real user behavior) instead of guesswork release products that users actually want.
When there are thousands of features available, which ones do you ship first? The most successful companies use data to help them answer this question:
Analytics Instrumentation: Applications log every user interaction – feature taps, screen views, time on screen, feature-specific metrics. A travel app compares “users who completed a booking” to “users who started booking but abandoned.” These breakdowns expose where user interest tops out.
Engagement Metrics Tracking: Top companies, most of which measure:
RICE Scoring for Prioritization Apply: When several features are contenders, leading companies score them with RICE.
A feature that has a large number of users, a strong positive impact, and requires very little engineering effort gets the highest priority and ships first. A feature with low reach, medium impact, and high effort is given a low score and ships later.
Incorporating User Feedback: Analytics tell us what users do; surveys/interviews tell us why. Top-tier companies supplement behavioural data with qualitative insight. “Analytics tell us that 30% of users drop out of the signup flow at the email verification step,” along with user interviews (“I never got the email”), uncovers the problem.
Iterative Improvement: Rather than “ship feature and move on,” top-quality companies will ship an MVP (Minimal Viable Product) version, see how users interact with it, and iterate. A feature can ship with 3 core flows initially, then add advanced flows based on usage.
Ask: “How do you decide which features to build?” Top-tier: “We look at user behavior data, perform RICE scoring to prioritize features, incorporate user feedback, and ship MVPs to validate assumptions before scaling.” Average: “We get requests from stakeholders and build what we think is most important.” Bad: “Our CEO/founder decides what features we need; we don’t have a lot of user data.”
Compiling for both iOS and Android will be mandatory in 2025. Companies that are native development, React Native, and Flutter speak can choose the best framework by project rather than pushing the same tool on all projects.
Three main methodologies exist, each with implications:
Native Development (Swift for iOS, Kotlin for Android):
React Native:
Flutter:
Elite companies have depth in all three approaches:
Native expertise: For Swift developers keeping pace with annual iOS updates (IOS 17, 18), and Kotlin developers. Are you familiar with Android-specific patterns? They can tell when the performance and feature access level of native development warrant the complexity.
React Native Fluency: Knowing when the code-sharing benefits of React Native outweigh its limitations. Knowledge of common libraries (React Navigation for routing, Expo for prototyping quickly). Drop down into native code if necessary.
Flutter competence: Dart knowledge, knowledge of Flutter’s widget tree and state management, and how to work with platform channels to use native APIs. Knowing when Flutter’s hot reload accelerates development velocity.
Pragmatic Framework Selection: Instead of “we’re a React Native shop” or “we’d never use anything but native,” top-tier companies formulate advice by project. A real-time gaming app goes native. A business application might go React Native. A UI-heavy creative app goes Flutter.
Ask: “What frameworks do you support?” Top tier: “We support native (Swift/Kotlin), React Native, and Flutter. Which framework to use is a project requirement —I would advise native for your gaming app because of performance requirements, but React Native would be the best for your business app if you had tight timelines.” Average: “We are mostly a React Native house; we can do anything with React Native.” Bad: “We use whatever the client wants; we have developers for any framework.”
Apps that work well at 10,000 users can crash and burn at 100,000 users without some form of architectural intervention. Best-in-class companies build for scale from the beginning, avoiding expensive architectural rewrites.
App Launch Time: From the user tapping on the icon to the first screen rendered. Target: <2 seconds (3 seconds is poor). Elite companies compress loading screens, delay non-critical initialization, and preload data.
Screen Load Time: When does a screen start? Target: less than 1 second for normal screens (less than 2 seconds for complex screens). The Best Load Fast companies lazy-load content, paginate lists, and cache responses.
API Response Time: When sending a request, how long does it take to get a response from a server? Target: Right on time <200ms for 95th percentile requests (meaning, not average—95th percentile, as we measure tail latency). Best-in-class also leverage CDNs, database optimization, and caching layers.
Crash-Free Rate: More than 99.95% crash-free sessions (covered in Signal 3).
Memory Usage: App should consume less than 100MB on typical devices (500MB would be overkill).
Battery Drain: The app should drain <10% of the device battery in 1 hour of heavy use.
High-end companies do load-testing on applications before release, with realistic traffic simulations:
Concurrent User Simulation: Testing at 10x the load of your predicted peak. If you forecast you will have a peak of 10,000 concurrent users, test at 100,000.
Realistic Request Distribution: Not “all users pummeling the same endpoint en masse.” Instead: 40% users browsing, 30% transacting, 20% streaming video, 10% admin operations. This emulates real traffic patterns.
Network Condition Simulation: Test in 4G (slow, high latency), 5G (fast), and bad network conditions (continuous failures).
Hardware Targeting: Testing on the lower end (2GB RAM, mid-range processors) as they cover a large percentage of the users.
Auto-Scaling Architecture: Instead of having a fixed server capacity, the best companies think about apps as scaling automatically:
Question: “How do you guarantee performance at scale?” Top-tier: “We load-test to 10x expected peak concurrent users pre-launch, meet <2sec launch time and <1sec screen load time SLAs, use CDNs and caching heavily, and build for horizontal auto-scaling from day 1.” Average: “We test on staging with representative load; so far, so good on performance.” Bad: “We’ll tune for performance if it becomes a problem.”
A data breach erodes user trust immediately. Compliance breaches (GDPR, DPDP, health care regulations) result in $10M+ fines. The best companies have security baked into the development process, not bolted on at the end.
Encryption in Transit: All network traffic is encrypted using HTTPS/TLS 1.3. Apps never transmit sensitive information (passwords, tokens, payment information) in the clear. Leading organizations require certificate pinning—checking server certificates for man-in-the-middle protection.
Encryption at Rest: Locally stored sensitive data on the device is encrypted via AES-256. The users’ payment methods, personal information, and authentication tokens are encrypted, and they can do nothing if the device is stolen.
Key Management: Encryption keys should not be hard-coded in source code (exploitable). Rather, keys are securely stored in platform-specific keystores (iOS Keychain, Android Keystore) and never sent out.
Multi-Factor Authentication: Users log in with something they know (password) and something they have (phone for 2FA). Financial apps require user identity verification with biometrics (Face ID or fingerprint).
OAuth2 for Third-Party: Apps never store passwords. OAuth2 instead delegates authentication to providers (Google, Apple, Facebook), reducing the exposure of passwords.
Secure Token Storage: The tokens are stored securely and rotated frequently.
Rate Limiting: Endpoints can rate limit each user to protect from brute force and DoS attacks. Example: “5 failed login attempts, account locked for 15 minutes”.
Input Validation: All user input (username, password, form data, etc.) on the app is validated server-side. Client-side validation for UX, server-side validation is for Security.
SQL Injection & Injection Prevention: Parameterized queries ensure attackers can’t inject malicious SQL.
Penetration Testing: Ethical hackers put the app through its paces, finding holes before the real hackers do. High-security companies perform penetration testing every quarter.
Dependency Scanning: Tools (Snyk, Black Duck) that scan your dependencies (third-party libraries) for known vulnerabilities. When vulnerabilities are addressed, the code is updated within days.
Code Security Reviews: Security code reviews (SCR) are a targeted review of the code for security-specific issues (e.g., hardcoded secrets, weak cryptography, lack of input validation).
Data Minimization: Top companies only gather what’s necessary. An app that doesn’t require calendar access won’t ask you for it. Fewer permissions = smaller attack surface.
Ask: “What’s your security posture?” Top-tier: “We employ AES-256 encryption at rest, TLS 1.3 in transit, OAuth2 for authentication, perform quarterly penetration testing, scan dependencies with Snyk, and apply rate limiting to all APIs. Our code is subjected to security-focused audits.” Mediocre: “We use HTTPS , and passwords are hashed.” Bad: “Security is not a big concern; we’ll fix it if it’s a problem.”
Beta testing with real users captures edge cases that internal testing does not. Apps that undergo thorough beta testing may have 20% to 30% fewer problems following their release.
TestFlight (iOS): Official tool for iOS beta testing. Apple provides its own solution for beta testing iOS apps, TestFlight. Developers can send out app builds to 100 internal testers and 10,000 external testers. Testers offer feedback, crash reports, and performance data.
Google Play Beta: Google’s alternative to Android apps. Developers specify closed beta tracks (2,000 users max per list) or open beta tracks (at least 1,000 testers). Testers install the root app from Google Play, but with a “App in development” tag.
Third-Party Platforms: TestFairy, Applivery, and Firebase App Distribution provide more features. They record session videos, crash logs, and structured feedback.
Structured Beta Phases: Elite companies conduct beta testing for 2-4 weeks before public release:
Internal Alpha (Week 1): 10- 20 internal testers (employees, contractors). Focus: core features, obvious crashes. Goes quickly—2-3 days of feedback.
Closed Beta (Week 2-3): 100-500 external testers. Focus: patterns of real-world use, edge cases, performance on multiple devices. Planned feedback via in-app surveys.
Open Beta (Week 3-4, optional): Thousands of testers attracted from Google Play or App Store. Focus: scale testing, network condition variations, diverse device/OS combos.
Tester Recruitment: Top-tier companies seek a diverse pool of testers:
Structured Feedback: Instead of a “tell us what you think” style, the best companies ask very specific questions:
Crash Reporting Integration: Devices of testers report crashes with stack traces automatically. Leading companies prioritize crash fixes before release.
Release Iterations: If beta surfaces problems, teams fix and release new iterations of beta. This cycle repeats until metrics are healthy (crash-free rate >99.95%, no critical issues reported).
Ask: “How do you do beta testing?” Leading edge: “We conduct a structured 3-4 week beta test with 100-500 testers on a variety of devices and OS versions via TestFlight and Play Beta. We gather structured feedback, track crash rates, and iterate until we achieve a 99.95%+ crash-free rate at public launch.” Passable: “There is a bit of beta testing involving chosen users; usually works fine.” Bad: “We release from staging; actual users serve as our beta testers.”
There are 2,000+ device models of Android with differing screen sizes, hardware, OS versions, and manufacturer customizations. An app that runs on Samsung will break on Xiaomi. Top-end organizations have a systematized strategy for controlling this fragmentation.
OS Version Distribution: Users have Android versions 10, 11, 12, 13, 14, and 15. Older versions still have 30-40% market share worldwide, more in India. Apps need to support no fewer than 3 major OS versions.
Manufacturer Customizations: Samsung One UI, Google Material You, OnePlus OxygenOS, Xiaomi MIUI—various producers customize Android, adding variables.
Variations in Hardware: Screen sizes ranging from 4 inches to 7 inches; RAM between 2GB and 12GB; processors ranging from Snapdragon 4-series to flagship Snapdragon 8-series.
Device-Specific Problems: iOS is mildly fragmented (Apple controls the hardware and the OS). Examples of severe Android fragmentation: a memory leak for low-RAM devices, a GPS problem for devices in Xiaomi, a Bluetooth problem for devices in OnePlus.
Target Device Matrix: Rather than “support all devices,” elite organizations focus on the 80% of devices that comprise 80% of their user base:
Real Device Cloud Coverage: Leading companies employ cloud-based real device labs, spanning 100+ device/OS combos, and testing automatically before every release.
Testing Low-End Devices: Often overlooked but essential—low-RAM and mid-tier devices are the best-sellers in India. Leading companies focus on testing on 2-3GB RAM devices.
OS Version Management: Apps are compatible with the minimum API level, for Example, Android 10 minimum to the Latest (Android 15). Testing is conducted within days of new Android version releases for incompatibilities with the new version.
Proactive Compatibility Monitoring: Instead of waiting for user crash reports, elite companies are tracking beta channels and OS pre-release versions, catching potential incompatibilities before public release.
Question: “How do you manage device fragmentation?” Top tier: “We analyze the distribution of user devices, determine the 80% of the devices responsible for 80% of the traffic, test extensively on those device/OS combinations on real device cloud covering 100+ configurations, and also test on low-RAM devices specifically. We watch pre-release OS versions to catch incompatibilities early.” Average: “We test on a handful of popular devices; most issues that arise are from user reports.” Low-quality: “Device fragmentation is a nightmare, and we do the best we can with what devices we have.”
To illustrate how these signals interact, imagine two fictional firms:
Company A (Top-Tier):
Company B (Average):
The Gap in Outcomes:
Company A’s app has, after 6 months:
Company B’s app includes:
The 2-3x difference in satisfaction and retention compounds—Company A brings in more users, reinvests in product, grows faster. Company B has a hard time growing, dealt with support issues.
Elite firms charge 25-40 per cent more than average vendors:
The 56% cost premium sounds expensive, until you factor in the total cost of ownership:
| Cost Component | Basic Company | Top-Tier Company |
| Initial Development | $90K | $140K |
| Post-Launch Bugs (Year 1) | $30K (in maintenance/support) | $5K (pre-emptively tested) |
| Architectural Redesign (scaling issues) | $80K | $0 (designed for scale) |
| Lost Revenue (poor retention) | $200K-500K | $0 |
| Support & Operations (Year 1) | $20K | $10K |
| Total Year 1 Cost | $420K-610K | $155K |
The top-tier option is still 60-75% cheaper in total cost despite 56% higher upfront cost.
The Indian mobile app development market in 2025 is expected to be very well-value for money, with world-class talent for 40-50% less cost than the developers in Western countries. The problem isn’t sourcing developers; it’s sourcing the very best developers.
The 12 signals below offer a systematic approach to assessment:
Instead of subjective terms such as “experienced team” or “proven track record”, evaluate vendors based on these quantifiable signals. Ask for solid data: dashboards of crash-free rates, screenshots from your CI/CD pipelines or from your beta test results, reports from load tests, or device coverage matrices.
The right partner will embrace this scrutiny—leading companies are proud of their processes and metrics. Mediocre vendors will be obfuscatory, throwing marketing speak as deflectors.
Your app will define your business for years to come. A one-time investment of 4-8 weeks in a comprehensive vendor evaluation saves years of regret for a poor partner choice.