
Success in software outsourcing in India requires you to implement proven project management methodologies, have complete quality assurance processes, have open lines of communication, and monitor performance with measurable KPIs that hold the outsource team accountable. 65% delivery Indian agencies are state-of-the-art in Agile-Scrum methodology and produce industry-best metrics like 3 Hours Mean Time to Recovery and 12% change failure rates, empowering businesses to outsource and yet retain partial or full control over timelines and quality deliverables.
The Indian software development industry serves more than 80% of the Fortune 500, and it is with its refined processes, skilled manpower, and proven quality frameworks that it doles out billion-dollar projects on a regular basis. But to take advantage of these opportunities requires knowing which specific practices, tools, and governance arrangements will transform outsourcing from a transactional supplier relationship into a strategic partnership capable of consistently delivering high-quality deliverables on time and on schedule.
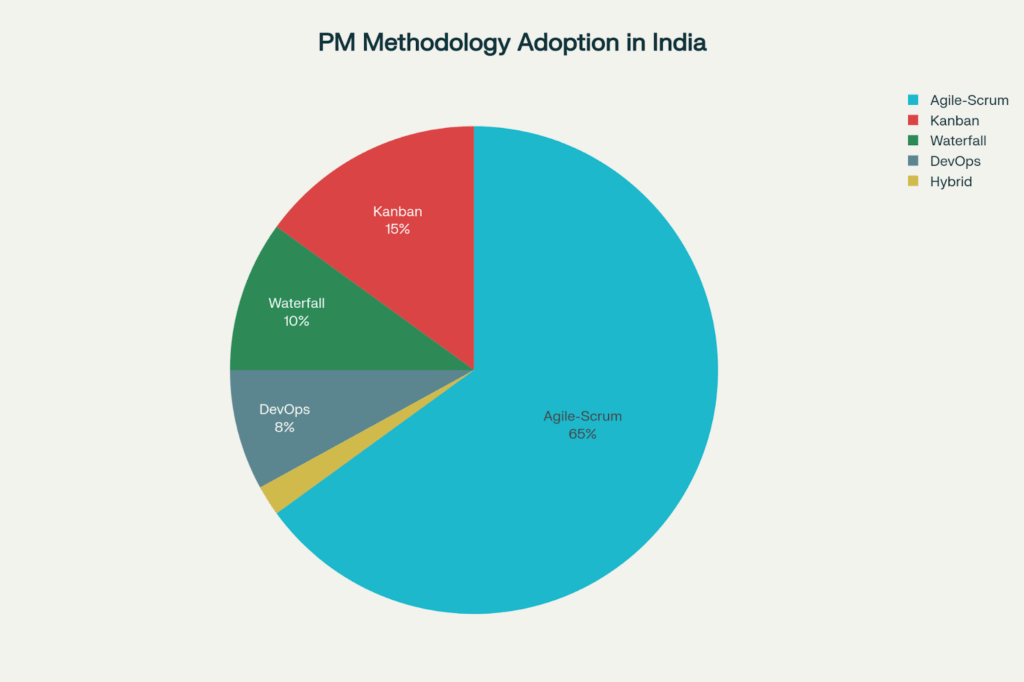
Agile-Scrum in India dominates at 65% in software development, followed by Kanban (15%) and traditional Waterfall (10%)
The selection of a project management methodology has a huge impact on schedule predictability, deliverable quality, and project success. Indian software houses have developed mature methodologies that are a blend of global best practices and local expertise; these methodologies are tailor-made for distributed development.
Agile-Scrum accounts for around 65% of the software development in India , which is indicative of its efficacy when dealing with complex projects that require a flexible approach and continuous client collaboration [PM methodologies data]. This phased approach breaks development into shorter sprints, generally 2-4 weeks, allowing for frequent feedback integration and adaptive planning.
Basic Scrum elements are:
Sprint planning creates commitments for work in near-future cycles, with a shared ownership in defining work deliverables, acceptance criteria, and effort estimation. Teams split requirements into user stories, apply complexity estimates using story points, then commit to attainable sprint goals, trying to find a balance between ambition and what they realistically can handle.
Daily Standups: Teams update each other on what they completed yesterday, what they are working on today, and any roadblocks they are facing in brief meetings (~15 minutes). These rapid interactions keep us in lock step with each other, help surface blockers right away, and prevent things from being siloed.
Sprint reviews represent working software that is demonstrated to stakeholders at the end of the cycle to gather feedback and provide visibility into the progress of the deliverable. These demos instill trust as they are based on tangible outcomes and not theoretical status reports, and therefore allow for making more informed decisions on potential changes in direction based on the real evolution of the product.
Sprint retrospectives enable continuous team-based improvement by reflecting on what went well, what could be improved, and what actions can be taken to improve in-sprint processes. This type of guided self-reflection allows you to turn experiences into actionable improvements, thereby compounding gains in efficiency over time.
Responsibility and decision-making are made clear by the roles of Scrum:
The Scrum Master acts as servant-leader and chief impediment remover for the team, as well as their coach and protector from outside interruptions. This specialized position guarantees process compliance while being flexible with respect to team-specific requirements of the framework.
The Product Owner captures the needs of stakeholders, orders the product backlog, writes acceptance tests, and decides which compromises to make between features, deadlines, and quality. Well-defined product ownership can help to guard against contradictory priorities or indecisive changes to requirements that can destabilize progress.
The Development Team is self-organizing to do the work (including cross-functional, doing estimates of effort, and sharing responsibility for quality) to accomplish the work to which it is committed. Groups of 5-9 members enhance communication and provide enough diversity of skills to deliver complete features.
Medium-term timeline predictability of Agile-Scrum derives from iterative planning—estimates grow more accurate as velocity baselines are established through successive sprints; however, fixed requirements are impossible to assume, as they are liable to change [PM methodologies data]. This trade-off between flexibility and predictability aligns well with most software projects where requirements are developed through user feedback and market learning.
Kanban methodology constitutes 15% in Indian software adoption, due to which is very good for day two support, maintenance, and continuous delivery scenarios [PM methodologies data]. In contrast to Scrum’s time-boxed sprints, Kanban supports a continuous flow where work items move through several predefined stages without being batched.
Kaizen principles are the following:
Tracking progress on work at a glance by using workflow on boards (backlog, in progress, code review, testing, done) and cards that contain details for each individual task. Visual management provides immediate visibility of the status, bottlenecks, and workload distribution among team members.
Limiting WIP: Avoid the inefficiency of multitasking by limiting the amount of work you have to do at each step in your process, and making you finish it before you start new work. Work in progress (WIP) limits highlight bottlenecks in capacity, foster collaboration on finishing work items, and prohibit the accumulation of work in progress in any form.
Controlling flow also separates cycle time into stages and stage-specific times by removing delays, minimizing fretting over handoffs, and workload unification. Ongoing tweaking of processes results in small, often barely noticeable gains in efficiency as opposed to having to continuously rework the framework.
The extraordinarily high degree of flexibility of Kanban allows for priority changes at any moment without affecting sprint commitments. It is very well suited for organizations or projects where demand is unpredictable and urgent requests or items in the backlog can be attended to at any point in time [PM methodologies data]. Nevertheless, due to poor timeline predictability, Kanban is often not recommended for fixed-deadline projects with committed dates of delivery.
Waterfall continues to have a 10% adoption in India, mainly for projects with fully defined upfront requirements, regulatory compliance, or fixed-scope contracts [PM protocols data]. This systematic approach goes through distinct phases—requirements, design, implementation, testing, deployment—with each phase being completed before the next one starts.
Benefits of waterfall include:
High level of schedule predictability, since upfront planning cannot be modified and full documentation is used; sequential phases make it possible to forecast the schedule with an accuracy of up to 95 percent [PM methodologies data]. Organizations that need firm commitments for budget approval, resource scheduling, or synchronized rollouts find the rigor and predictability of Waterfall advantageous.
Uniform documentation from all phases of development results in detailed functional specifications, design documents, test scripts, and maintenance procedures that ensure the long-term viability of the application. Regulated industries, which require an audit trail and the ability to confirm compliance, particularly appreciate comprehensive documentation.
Predefined milestones give a measurable indication of progress and serve as payment triggers, which makes managing vendors and financial planning less complex. Phase-gate reviews are used to guarantee that the expectations of the stakeholders are aligned prior to investing in further stages.
Nevertheless, the rigid nature of Waterfall also makes it hazardous in the presence of requirements uncertainty, with any changes at a late stage being costly to implement and disruptive [PM methodologies data]. Late-stage quality control. The testing phase is concentrated after the production work is done, so late-stage quality control may identify major problems that require going back and reworking the product at great expense.
Waterfall is a good fit for well-defined projects such as regulatory compliance, system conversion, where requirements are known in advance and unlikely to change because of regulatory or technical reasons [PM protocols data].
DevOps adoption, hitting 8% in India, is on the rise as organizations are adopting cloud-native architectures, microservices, and continuous deployment [PM methodologies data]. DevOps is also the cultural practice, automation tools, and architectural patterns that seamlessly enable rapid, reliable application delivery from development to production.
DevOps practices are among the following: Continuous integration builds and tests code changes multiple times a day, enabling developers to find and fix integration errors immediately, rather than waiting for the less frequent manual merges. Pipelines are automated pipelines to ensure that new code builds, tests, and maintains quality before merging.
In continuous deployment, the release process is automated not only from code commit to production deployment, but also manual errors are eliminated, and delivery is getting faster. Instead of releasing quarterly, organizations deploy multiple times a day, fuelling faster feedback cycles and value realization.
Infrastructure as code, servers, networks, and configurations are defined in versioned scripts, which can be used to provision the environment repeatedly and help prevent environment drift. When infrastructure is automated, resources spend less time troubleshooting inconsistent setups that lead to the dreaded “works on my machine” problems.
Monitoring and observability enable real-time insights into system performance, user activity, and the health of systems, allowing for early anomaly detection and data-informed performance optimization. Complete telemetry converts reactive firefighting into predictive maintenance.
But DevOps is a mature automation that requires skilled teams and cultural commitment to the department’s collaboration versus siloed, well-as-tall-pyramid systems. Good timeline predictability results from reduced variability due to automation, while continuous quality control identifies problems in the early stages through frequent testing.
Hybrid approaches account for 2% of adoption, yet increase as organizations tailor frameworks based on particular contexts [PM methodologies data]. Typical hybrids include merging Agile development with Waterfall-based planning, applying DevOps automation over Scrum processes, or modifying frameworks for distributed teams.
Good hybrids tend to keep the core principles of the methodology intact but adapt the ceremonies, artifacts, or practices for the realities the organisation faces. As an example, enterprise customers sometimes demand Waterfall-style upfront contracts and fixed-price commitments, whereas their development teams are using Agile to get the best bits of work done.
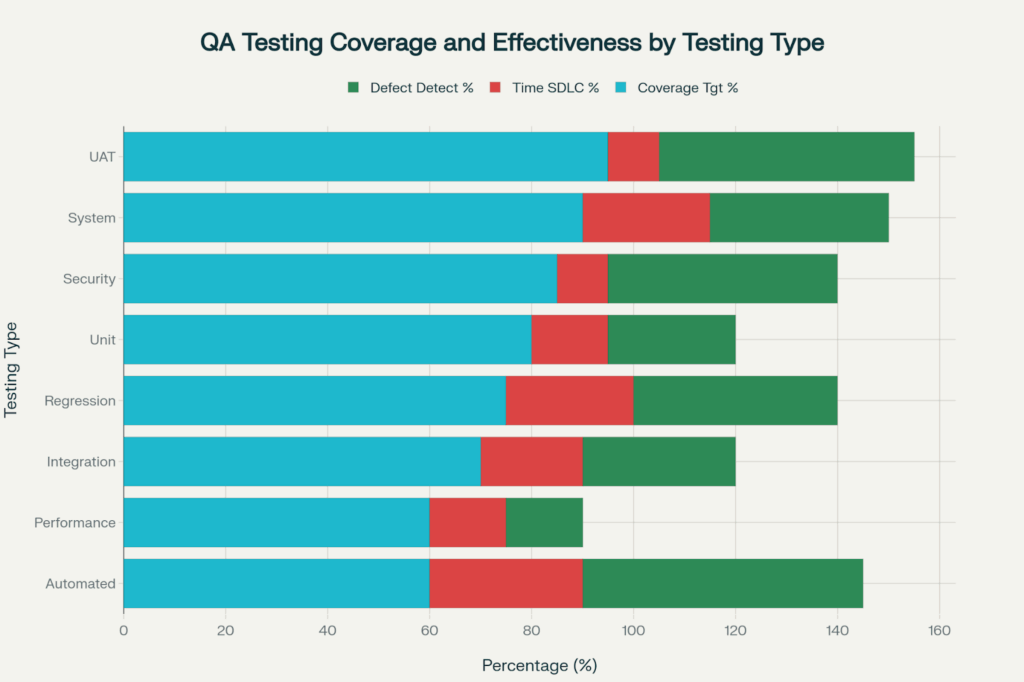
User Acceptance Testing provides the highest level of coverage at 95% and detects 50% of the defects, whereas the time spent on automated testing is 30% of SDLC time, with defect detection of 55%
Quality checks go beyond just testing at the end and include continued verification throughout the development processes. Indian software firms employ multi-tiered QA methodologies that include automated and manual testing, code quality tools, and established quality gates to guarantee full defect prevention and detection.
Unit testing aims for 80% coverage, testing individual functions, methods, and classes on their own to find logic errors as soon as possible, when the cost of fixing them is the lowest [QA testing data]. Developers write unit tests along with code, with many practicing Test-Driven Development (TDD) where test writing precedes code implementation.
Benefits of unit testing include:
Early detection of defects finds bugs earlier in development, when there is less context switching and less rework is required, and reduces the risk of downstream/in-production bugs. The 25% defect removal rate in the unit testing phase removes defects before the complexity of integration masks the root cause [QA testing data].
Regression safety: automated test suites run on every commit of code to make sure new changes do not break existing features. Continuous validation can stop subtle regressions that could be missed by manual testing until customer discovery.
Design improvement: as developers write testable code, they are led naturally to better designs, including cleaner code, less coupling, and better separation of concerns. Code that’s impossible to test is often a symptom of flawed design that needs to be refactored.
Value to documentation: tests act as executable specifications and demonstrate how the code is intended to be used, serving as a guide for written documentation. Tests don’t get out of date the way documents do, since failing tests compel updates while code is being changed.
Unit testing requires about 15% of the SDLC duration, so the quality gains come at little associated cost, rendering it an efficient investment in quality [QA testing data]. Popular modern frameworks such as JUnit for Java, pytest (Python), and Jest (JavaScript) provide easy ways to write unit tests with little overhead.
Integration testing targets 70% coverage to check that the building blocks developed in the previous stage work together [QA test data]. This level of testing is capable of detecting interface mismatches, inconsistencies in data formatting, and timing issues that are not detected when unit tests run alone.
Approaches to integration include:
API contract testing asserts that services expose and consume APIs as per the documented contracts and helps in avoiding the breakage of integration due to breaking changes. Contract violations are detected without needing the entire system assembled.
Database integration tests that the data access layer works properly against a real database instead of a mocked one, that queries execute as expected, transactions are rolled back or committed correctly, and that migrations can be run up and down without issue. Testing with a real database identifies problems with the SQL dialect, potential performance problems, and locking issues.
A third-party service integration tests interaction with third-party APIs, payment gateways, authentication providers, and so forth, under multiple scenarios, including timeouts, drop calls, rate limiting, and it covers edge cases as well. Rigorous integration testing avoids any unnecessary surprises in production due to external service behavior.
Integration testing takes up 20% of SDLC time and cost is of moderate effect while evaluating thoroughness against complexity [QA testing data]. At 30% defect removal, it captures the faults that unit testing misses, and is more cost-effective than system testing [QA test data].
System testing is aimed at achieving 90 % coverage, checking full, integrated applications against end-to-end requirements testing [QA testing data]. This tier emulates actual user profiles, data sizes, and activities within production-like environments.
Types of System Testing:
Functional testing ensures that all the features work as specified in the scope, which includes normal flow, edge conditions, error validations, and boundary test cases. Complete functional testing gives you high assurance that your application does the job it was designed to do.
Performance testing measures response time, throughput, resource utilization, and scalability for both anticipated and peak workloads [QA testing data]. System performance checks prevent the occurrence of production issues due to unforeseen workload or an unproductive implementation.
Security testing assesses for multiple security vulnerabilities such as injection, authentication, authorization, session management, and others [QA testing data]. Security testing is essential in keeping sensitive data safe and remaining compliant, as it is estimated to contribute to 45% of defects with 85% coverage objectives.
Compatibility testing checks the software applications for various browsers and devices, platforms, operating systems, and screen resolutions for a uniform user experience. Especially, mobile applications need to be tested for compatibility in depth over device fragmentation.
System testing has its time proportion [QA testing data, about 25% of SDLC] and high cost implication, so it needs extensive planning, but the percentage of defects found (35%) and the total system check make a good investment. A large number of critical defects are exposed only by whole-system interaction.
UAT meets 95% of coverage targets, ensuring that the application satisfies the business needs and allows users to perform their jobs as expected [QA testing data]. Unlike technical testing, UAT is made up of real users or business stakeholders executing realistic scenarios in an environment that is similar to production.
Importance of UAT:
Validation of requirements delivered states the functionality delivered the business needs, not just the technical specifications, so catching errors in requirements interpretation before production. The 50% detection rate is the highest for any testing phase and shows that UAT from a business perspective discovers more issues that technical teams don’t find [QA testing data].
Usability testing checks if users are able to complete tasks quickly using intuitive interfaces, workflows that seamlessly flow, and do not confuse users, along with meaningful error messages. It is not good enough that the product is technically correct if the users are being led down confusing or long-winded paths.
Checking acceptance criteria provides a factual basis for deciding if the deliverables pass pre-defined success measures, enabling go/no-go decisions for the release and final payment. Well-defined acceptance criteria avoid endless revision iterations based on the perceptions of quality.
10 % of the SDLC time is by design allocated to UAT, which allows business validation activities to be in focus, and the business can do shall testing without wasting time doing re-testing of technical details that have been tested [QA testing data]. This level of efficiency assumes solid prerequisite testing to ensure that UAT is focused on validating the business, not on identifying fundamental defects.
Sixty percent of testing coverage is achieved by test automation, and manual test execution is replaced by scripts that can be run rapidly, consistently, and repeatedly [QA test data]. 30% of SDLC time for the time investment represents the overhead for the development of automation, while the 55% of defects that it catches and the continuous executable integrated delivery model really is an extraordinary value.
Automation advantages:
Quick feedback – tests are ready in minutes vs. hours or days to perform manual testing, so issues can be identified sooner. Fast feedback loops lead to faster development since problems are detected while the context is still fresh.
There is also a high efficiency of regression testing, which enables comprehensive retesting at every code push, preventing unnoticed breaking of working code without manual overwork. Although manual regression testing can become time-consuming, automated regression testing can keep pace with evolving codebases.
Reliability and consistency remove human error, attention exhaustion, and variability in execution that are common contributors to false negatives in manual testing. Automated tests run exactly the same way every time, so you get reliable quality signals.
Simultaneous execution enables the execution of multiple browsers, devices, and environment configurations, enabling you to get hours of manual effort in just minutes. Cloud testing platforms allow you to run parallel test execution to your system’s full scale capabilities.
The investment in automation pays its dividends over time, as tests are run thousands of times during the lifetime of an application, and the expense of development is distributed across those runs. Established, mature features are especially good candidates for automation, freeing human testers to explore and test new functionality.
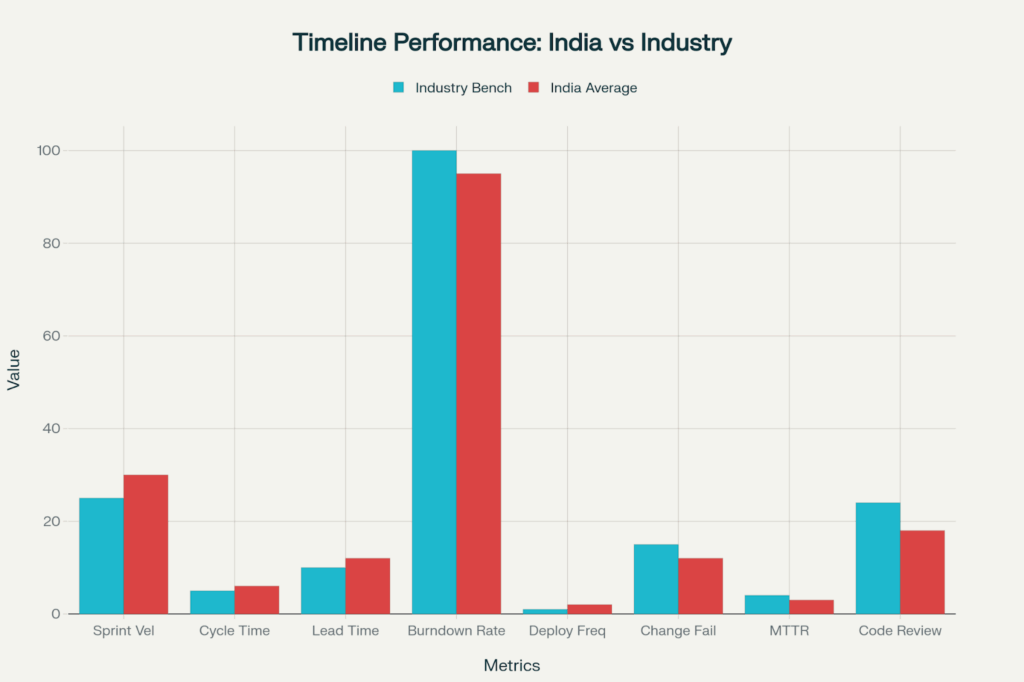
Indian software development teams are at par or better than industry standards across the majority of timeline metrics, with outstanding results for MTTR (three hours vs four-hour target) and change failure rates (12% vs 15% limit)
Tracking performance with objective metrics turns subjective evaluations into data management, allowing for early corrections when projects stray. Indian software companies measure end-to-end KPIs that give insights related to productivity, efficiency, and delivery predictability.
Sprint velocity is the amount of work a team can handle in a single sprint and is a measure of how much effort is completed in an iteration, usually calculated in story points, which are a measure of relative effort, not of absolute time [Timeline metrics data]. The Indian teams contribute an average of 30 story points per sprint, and this is in line with the industry standards of 25 – 35 points [Timeline metrics data].
Calculation and use of velocity:
On the relative complexity scale (Fibonacci sequence: 1, 2, 3, 5, 8, 13, 21), teams estimate user stories during sprint planning, and the sum of the completed stories at the end of a sprint is known as the velocity. Average velocity becomes stable after 3-4 sprints, and it can predict the near future reliably, so it can help team members enough.
Capacity planning estimates the number of sprints to completion by dividing the remaining backlog by the average velocity. For example, 300 story points with 30 point velocity means 10 sprints or about 20-25 weeks based on sprint duration, so the team will take 20-25 weeks to complete the 300 story points.
Trend analysis monitors velocity over time and assesses if the teams speed up due to learning, stabilizes at a sustainable pace, or slows down from technical debt or burnout. A decreasing velocity means that there are quality issues, architectural problems, or team dysfunction that need to be addressed.
Workload Balancing: Reports an individual’s contribution to the team average, and shows if a team member is overloaded or underutilized so you know who needs you to think about handing off some work or taking on a little more. Large discrepancies indicate unrealistic estimates, skill mismatches, or breakdowns in collaboration.
That said, there certainly are velocity gaming incentives, such as teams padding estimates to look more productive, or management taking velocity and using it as a crass tool to compare across teams, without regard to contextual differences. Velocity acts as a planning tool, rather than a performance measure for teams or individuals.
Cycle time counts the time when and how long the task is being worked on, which is on average 6 days for Indian teams as compared to benchmarks of 5-7 days [Timeline metrics data]. This metric shows how well the execution is going and identifies bottlenecks in the process, even if the estimations are way off.
Cycle time components:
Active work time is the development, testing , and review work that has been performed on the task. Comparison of active time to cycle time is a measure of waiting times, impediments, and system waste.
Wait time may be waiting in line for code review, deployment access, feedback from a stakeholder, or the availability of a test environment. Too much waiting time is a sign of a bottleneck in resources, a bottleneck in approvals, or simply failed coordination.
Rework includes time for bug fixes, requirement clarifications, and work that had to be redone due to quality issues or misunderstood requirements. High rework values indicate poor up-front analysis, poor-quality code, or volatile requirements.
Analyzing cycle time by task type, complexity, and assignee can surface trends such as tasks of a certain size requiring a disproportionate amount of time to complete, certain developers being consistently faster, or work for a specific client having that work needing a longer turnaround time. This type of insight enables focused solutions that address real, rather than perceived, constraints.
Decreasing cycle time leads to faster feedback cycles, more frequent deployments, and better predictability — and has the potential to be achieved without having to work more hours. Processing time by removing waste results in better not longer working.
Lead time ranges from identification of the need to deployment in production, with an average of 12 days for Indian teams compared to 10-15 day benchmarks [Timeline metrics data]. It summarizes all portions of the delivery pipeline, including planning and prioritization as well as development, testing, and release.
Lead time analysis reveals:
Time to market of features from ideas until they are in the hands of customers, which is very important for business agility and responsiveness to competition. Shorter lead times allow for faster experimentation, learning, and adapting to market feedback.
Process efficiency throughout the whole value stream, such as delays in refining requirements or loops of approvals, or even the setup of the environment, or in the deployment process. Full transparency surfaces systemic issues that development teams don’t control, which may manifest as multi-team, cross-organizational, or even cross-company flow issues.”
Predictability charts through lead time distribution analysis, displaying ranges of variability and causes of outliers. High variability suggests processes that are unpredictable , which must be stabilized prior to being improved.
Comparing cycle time with lead time shows you how much of the work is waiting to be started versus how long it took to actually perform the work. Big differences could indicate prioritization issues, resource constraints, or too much WIP for teams to focus on.
Burndown rate monitors remaining work during sprints, aiming for 100% but delivering 95% for Indian teams [Timeline metrics data]. Visual burndown charts rise daily as story points are left over, and can show whether teams are moving at an appropriate pace with respect to sprint goals.
Burndown interpretation:
The ideal trajectory has a linear descent from the start of the commitment through to zero at the end of the sprint, and is shown by the dotted line on the charts. This optimal route presupposes constant daily work progress.
Real trajectories are unusual to follow the ideal trajectory; they exhibit a bumpy descent according to how tasks get accomplished, blocked, and if the scope of the project changes. When you compare actual to ideal, you can see if sagging, lagging, or the sprint team is up on their heels on schedule.
Early warning signals are present when actual lines diverge significantly from ideal lines, which suggests unrealistic commitments, underestimating complexity, or as a result of unforeseen difficulties. Mid-sprint intervention opportunities exist when problems surface early .
Scope creep can be detected as upward bumps in burndown charts when additions of new work are made faster than work is completed. An increasing burndown line indicates that a scope is growing uncontrollably and is putting sprint goals at risk.
The completion with 95% velocity shows that Indian teams just barely fall short in terms of carrying small work items into the next sprints, and they do not really deliver 100% [Timeline metrics data]. This slight variation makes for a healthier pattern than consistently striving for 100% which indicates conservative commitments or scope cutting to meet arbitrary targets.
Frequency of deployment gauges release cycle speed with Indian teams running at twice-weekly benchmarks of 1-2x weekly [Timeline metrics data]. A higher frequency of deployment makes it possible to have faster feedback, smaller change batches, and lower risk of deployment.
Benefits of increasing deployment frequency include:
Since faster feedback loops get features into the hands of users sooner, developers can more quickly learn if a feature is valuable, usable, or if it performs well technically. Feedback cycles are shorter, and users don’t spend time and money pursuing features they don’t want.
Small change batches have fewer modifications and therefore lower risk during deployment, and also simplify troubleshooting and rollbacks in case of problems. Massive quarterly releases have proven to be more difficult to debug than incremental weekly deployments.
Increased team morale is a side effect because developers get to see their work actually reach users instead of getting held up in staging environments. A steady cadence of production deployments results in satisfaction and motivation across the team.
Business agility is enhanced when enterprises can rapidly deploy fixes, respond to competitive threats, or pursue market opportunities. Developing the technical capability to deploy frequently can offer strategic options.
Still, value isn’t guaranteed just because you’re deploying often – shipping low-quality code frequently just causes more pain than shipping high-quality code less frequently. To strike the right balance between frequency and quality, you need a good dose of automation, testing, and monitoring.
Change failure rate tracks what percentage of deployments led to an incident in production, with Indian teams performing at 12% versus < 15% industry thresholds [Timeline metrics data]. This measures the quality of deployments and process maturity directly.
Failure causes include:
Incomplete testing defects are allowed to production due to insufficient test coverage, or tested related edge cases were not identified, or the tested related environment conditions are not realistic enough. Increased investment in testing decreases the failure rate, but at the cost of more work and slower feedback.
Bad deployment can add some noise through manual steps, configuration errors, or trapping processes that are not fully worked out. Automation removes human error and standardizes processes.
Suboptimal monitoring contributes to the diminished ability to recognize performance degradation, errors, or anomalies that further affect the customers. A high level of observability allows proactive actions.
Since architectural complexity tends to increase the failure surface area by event-driven, interdependent services, shared databases, and tight coupling magnify the impact of change. Microservices architectures with well-defined boundaries can contain failures.
The 12% change failure rate demonstrates strong quality practice in Indian development [Timeline metrics data]. Further progress will need ongoing investment in test automation, deployment rigor, and architectural excellence.
MTTR is the average time to recovery after service is lost due to an incident, with Indian teams meeting 3-hour recovery versus < 4-hour benchmarks [Timeline metrics data]. Rapid recovery reduces impact on customers and is evidence of operational maturity.
MTTR sub-components:
Time Detection Incidents from their occurrence until the team is made aware of them via monitoring, alerting, or customer communications. Holistic monitoring and alerting minimize detection latencies.
Diagnosis Time Includes problem discovery, root cause analysis, and remediated determination. Good Systems Design. Good logging, tracing, and observability help reduce time to diagnosis.
Remediation time encompasses fixing, testing, and rolling out to production. Rollback-enabled workflows or automated deployment pipelines improve remediation speeds.
This step verifies if the fixes to the problem actually solved it and didn’t cause any other problems. Monitoring confirms the functionality has been restored and is performing as expected.
An average 3-hour MTTR shows competitive incident response management in Indian teams [Timeline metrics data]. Sub-hour recovery is enabling technology like automation, runbooks, and focused on-call rotation(s).
Average review time is under 18 hours for Indian teams compared to <24-hour benchmarks [Timeline metrics data]. While you are meeting thresholds, additional reduction will only create a better developer experience and faster feature delivery without negatively influencing the quality of those benefits.
Optimization of review time:
Reviews are faster with smaller pull requests because reviewers are able to efficiently deal with a limited set of changes rather than giant diffs. PRs of 200-400 lines are small enough to give them a thorough review, and not too large for the cognitive load.
Meaningful, clear descriptions of why changes were made, what was tested, and attention to what to look for in the review to quickly get context for a reviewer. Answer reviews before they are submitted (and proactively answer implicit questions in your code), and you will save iteration cycles.
Review guidelines help standardize the evaluation, ensuring a consistent depth of review and that nothing is overlooked. Syntax, style, and simple quality tests can be run automatically, allowing reviewers to focus on evaluating the logic and design.
Scheduling review time dedicated to the activity, and considering code review as their primary work instead of distractions, allows for better response time and quality of reviews. Groups that meet on a regular basis for reviewing pace themselves.
There are educational, defect detection, and quality-enhancing effects of code review that compensate for spending time in it.. On the other hand, reviews have to be sufficiently thorough yet sufficiently fast, without becoming over-perfectionistic and delaying progress.
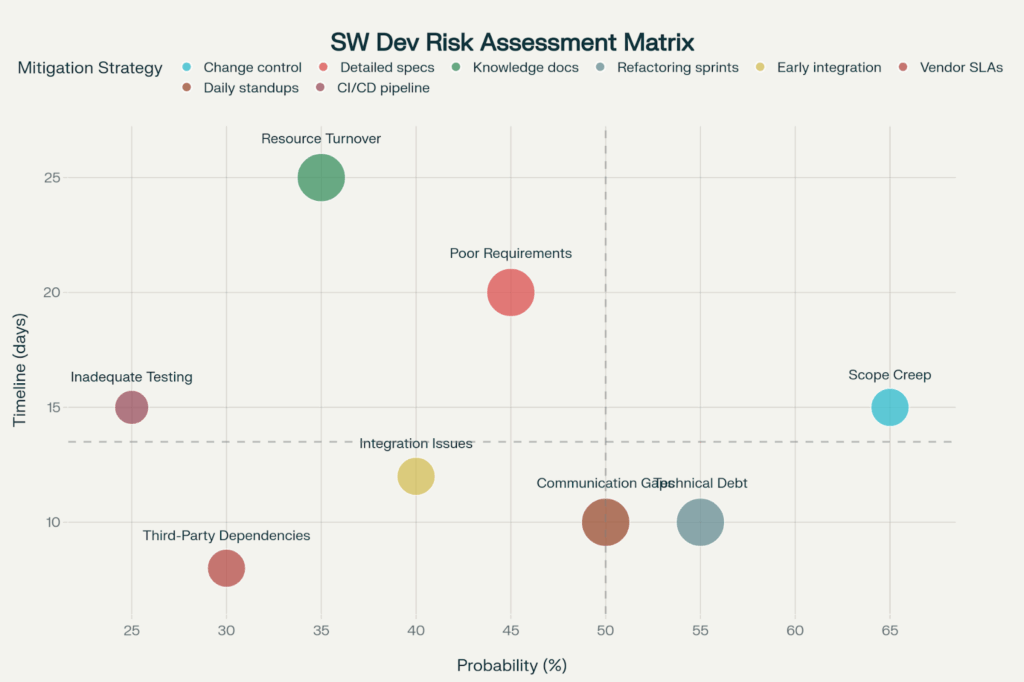
Scope creep produces the greatest combined threat with 65% likelihood and 15 days impact on the timeline, whereas resource turnover results in the highest potential delay of 25 days, even though lower likelihood.
The early detection and mitigation of risks prevents schedule and quality-related risks from derailing programs. Knowledge of common risks, as well as their probability and impact, allows prevention efforts to be focused on the greatest threat scenarios.
Scope creep impacts 65% of projects, with an average of 15 days added to timelines, which in turn causes the most risk [Data on risk factors]. Requirement creep, feature creep, and ”just one more thing” requests accumulate out of control, ballooning original estimates and budgets.
Drivers of Scope Creep:
As initial requirements are vague, this creates ambiguity and enables stakeholders to assert features were “always intended” despite no documentation [Data on risk factors]. Ambiguous directions are not feasible to follow since the criteria of success are not specified.
Divergent stakeholder expectations. As different stakeholders have different expectations, each adds features to the solution that align with his/her priorities, creating conflict [Data of risk factors]. In the absence of a strong prioritization authority, teams try to please everyone, endlessly adding features.
Gold plating – Developers add “nice-to-have” features that go beyond the requirements, taking up time and not providing the agreed-upon value [Data of risk factors]. But unauthorized scope expansion delays critical delivery, though with good intentions.
Scope change mitigation implements formal procedures for assessing, pricing, and approving changes to scope:
Change request forms must be supported by written justification, business case, priority, and impact analysis prior to approval [Risk factors data]. Documentation can create accountability and provide trails for decision-making.
The change control board, at its regular meetings, reviews requests for consideration and assesses the trade-offs between the proposed changes and the schedule and budget constraints [Risk factors data]. The designated authority that stops any ad-hoc decisions from becoming endless additions.
Assessment of impact calculates changes of scope in story points, days, and cost is made explicit via trade-offs before approval. [Risk factors data]. The stakeholders buy it that new features need them to extend the schedule or reduce the scope somewhere else.
Baseline protection retains original agreements while allowing for legitimate changes via the means of formal amendments [Risk factors data]. Good baseline documentation will allow for an objective determination of how much deviation.
Inadequate requirements impact 45% of projects with a 20-day delay, resulting in the highest average delay among common risks [Risk factors data]. Unclear, incomplete, or conflicting requirements lead to expensive rework after inconsistencies are identified in development or test.
Quality issues for requirements:
Multiple interpretations are caused by ambiguity, and developers implement one interpretation when the stakeholders expect another [Risk factors data]. Terms such as “user-friendly,” “fast,” or “intuitive” have no objective meaning.
To be incomplete creates a gap of functionality that is filled in the course of the development, causing distractions [Risk factors data]. Undisclosed non-functional requirements, such as performance, security, or compliance requirements, are found late.
Contradictory the answers to these questions to each other so they can not be fulfilled at the same time [Risk factors data]. Contradictory directions from different stakeholders (without any resolution between them).
Detailed specification mitigation invests upfront effort, avoiding downstream waste:
User story workshops are held with stakeholders to describe the requirements using specific examples, acceptance criteria, and user scenarios [Risk factors data]. Influenced elicitation needs surface that stakeholders have difficulty expressing their needs in an unprompted mode of communication.
Prototyping and wireframes represent potential functionality, and stakeholders are able to share their thoughts prior to development investment [Risk factors data]. Misalignment is what text does to pictures to prevent.
The objective measures of success of each acceptance criterion are defined so that quality decisions cannot, at any point during the definition or implementation, be subjective [Risk factors data]. Well-defined criteria make it possible to unambiguously pass or fail.
The traceability of requirements traces delivered features back to the source requirements and vice-versa, which ensures full coverage and that none are unauthorized added [Risk factors data]. Traceability matrices allow for an objective measurement of completion.
Turnover of developers affects 35% of projects, causing a delay of 25 days, the longest time impact, although its smaller probability brings some comfort [Risk factors data]. Knowledge transfer is needed when teammates are lost, along with hiring replacements, onboarding them, and ramping up in terms of productivity, all of which can add significant time to schedules.
Turnover implications:
Knowledge removal when developers leave takes project context, architectural decisions, code knowledge, and tribal knowledge with it [Risk factors data]. Individuals remaining on a team will have difficulties with understanding decisions that were not documented or code that is obscure.
Replacements for lost staff are not the only ones affected by productivity hits; the entire team feels their impact as colleagues answer questions, provide additional context, and cover for diminished bandwidth [Risk factors data]. It takes 3-6 months to regain full productivity.
Quality loss occurs through ripple effects when new developers alter subsystems about which they have no deep systemic knowledge, inadvertently introducing subtle bugs or architectural violations [Risk factors data]. Steep learning results in a higher risk of defects.
Mitigation of documentation dependencies protects institutional knowledge from turnover:
Well-documented decisions, including architecture decisions, design rationale, setup instructions, and operational knowledge, allow knowledge to be shared beyond a single individual [Risk factors data]. Living document continually updated to keep relevance.
Code comments and standards document what would otherwise be non-obvious code logic, architectural patterns, and significant constraints in the code itself in a way that is accessible to developers at the point when they most need to know about them [Risk factors data]. Properly commented code is intent-driven code.
Pair and mob programming spread knowledge among several team members in the course of collaborative development [Risk factors data]. Shared ownership of the code eliminates single points of knowledge failure.
Phased transitions allow for bear out and bear in, directly transferring knowledge via shadowing, pair work, and handoff sessions [Risk factors data]. Hasty transitions discard essential context.
Technical debt builds up in 55% of projects, impacting timelines by 10 days, and resulting in medium-term reduction in quality and long-term maintenance nightmares [Risk factors data]. Shortcuts, workarounds, and quick fixes address today’s problems but create tomorrow’s costs.
Causes of debt accumulation are:
Pressure to deliver incentivizes coding by the seat of the pants, writing fragile code that is not tested, or using copy and paste (bomb code) to meet deadlines [Risk factors data]. The short-term benefit of speed is paid in long-term maintenance.
Inadequate refactoring permits degradation of code quality as features are added to patchwork solutions that have been insufficiently altered from their original form to suit changed requirements [Risk factors data]. Every new addition gets harder, as the architecture is stretched to support requirements it was never designed to.
Learning and experimentation naturally lead to less-than-ideal initial versions that get better with time [Risk factors data]. Early code must be revisited as knowledge evolves.
Refactoring sprint mitigation is an intentional sprint buffer for paying off debt:
Debt tracking of whole known technical debt items with impact assessment in order to prioritize the most costly ones [Risk factors data]. Explicit lists of debt avoid invisible debt accumulation.
Continuous refactoring dedicates (typically 10-20%) of sprint capacity on a continuous basis to process improvement rather than exclusive feature development [Risk factors data]. Constant maintenance prevents catastrophic neglect.
Quality registers the debt through tools like SonarQube with metrics on the complexity of the code, how much of it is duplicated, and how maintainable it is [Risk factors data] [Code quality data]. Objective indicators identify when quality deteriorates to the point that action is needed.
Architectural reviews also challenge system design in light of present-day requirements, and highlight where the system needs to be brought into the modern age [Risk factors data]. Preventive redesign is effective in avoiding crisis-driven emergency rewrites.
Integration difficulties cause a 12-day delay in 40% of projects, and are especially hard to resolve when different teams, vendors, or systems merge their efforts [Risk factors data]. Interface incompatibilities, data format mismatches, and timing assumptions cause failures when separately constructed modules are integrated.
Integration Challenges:
Interface mismatches arise when components have different expectations about APIs, data formats, or protocols of interaction [Risk factors data]. The integration wars will not end. Lack of integration planning pushes vital decisions towards ‘forced integration’ where contradictions are uncovered.
Differences in environments between development and testing, and production lead to configuration mismatches, causing production failures even though they passed testing [Risk factors data]. Environmental parity is good for a safe surprise for deployment.
Concurrency and race conditions occur in production under load, even though they pass deserialised tests – because parallel execution invalidates timing assumptions [Risk factors data]. Load testing exposes multi-user conflicts.
Early integration mitigation instead combines work in a continuous manner during the project, instead of delaying it to the end of the project:
Continuous integration performs check-ins and merges several times a day, which quickly reveals integration problems while context is still recent [Risk factors data]. Automated build and test pipelines offer quick feedback.
Interaction testing also checks that components interact correctly during the development process, rather than when they are integrated at the end [Risk factors data]. Incremental integration mitigates big-bang risk.
Contract testing explicitly sets and tests interface expectations between services, and breaks quite fast when those expectations are not met [Risk factors data]. Consumer-driven contracts allow the provider to know if it breaks compatibility.
Environment Automation: To automate this environment, providing consistent infrastructure across all stages of the environment through infrastructure-as-code, so we do not have wasteful and manually performed environment drifts between these environments. Automated environments assure test validity.
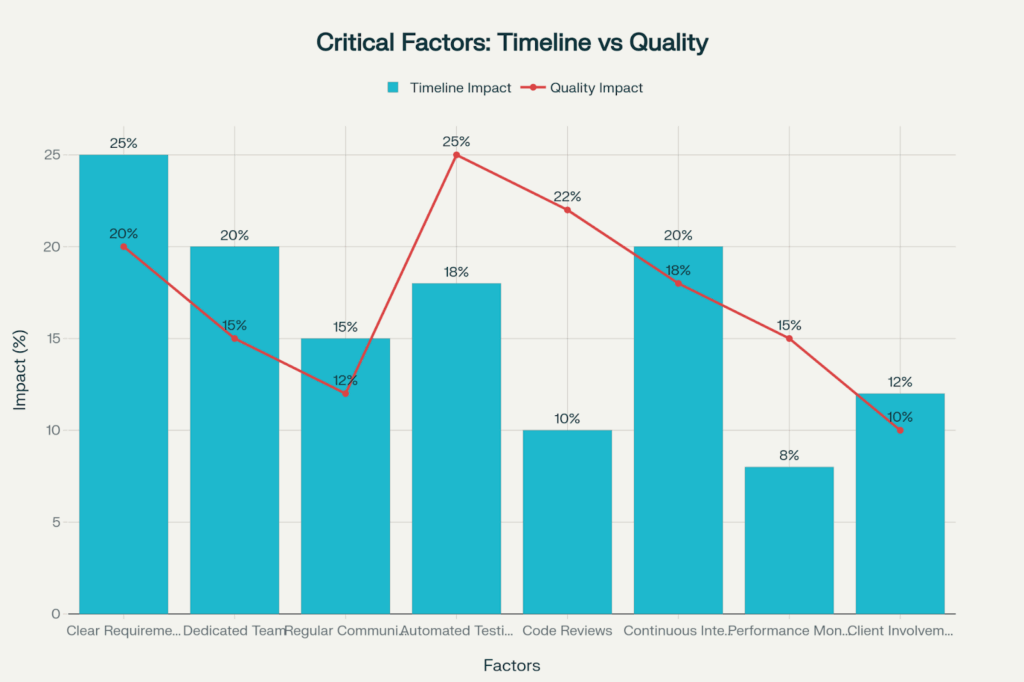
Ambitious requirements propel the timeline by 25% and quality by 20%, and testing automation has the greatest impact on quality at 25% and also provides 18% timeline improvements.
Productive communication goes beyond simple status reporting to foster a shared awareness, enable fast resolution of issues, and facilitate shared work among distributed teams across time zones and cultures. Indian agencies use integrated tools and methods to keep them aligned despite being miles apart.
Project management tools 85% usage in India led by Jira and Asana, with centralized visibility of work status, timelines, and team capacity [Communication tools data]. These platforms convert nebulous work into concrete tasks with owners, due dates, and the ability to track progress.
Platform capabilities:
Task management Partitions projects into tasks that include assignments, due dates, priorities, and dependencies to build execution roadmaps. Visual boards (Kanban) or list views (Gantt charts) are good for different working styles.
Sprint planning enables backlog refinement, capacity planning, and sprint commitment with simple drag-and-drop interactions and effort estimation. Built-in velocity tracking enables realistic planning.
Progress dashboards roll up data across teams, projects, and time so that leadership can see the status without having to have constant status meetings. Real-time dashboards provide answers to “where are we?” questions on demand.
Workflow automation performs actions in response to changes in state, deadlines, or conditions—such as assigning reviewers when tasks are finished, notifying stakeholders of blocks, or automatically updating related items. Automation avoids the overhead of manual coordination.
Reports and analytics provide burndown charts, velocity trends, cycle time analysis, and other metrics to help with data-driven management. Historical process data can be used to forecast and to improve processes.
The tool selection and adoption, therefore, are good indicators of the overall platform effect on both schedule and quality [Communication tools data], that is, Critical! However, tools also need discipline – platforms offer a framework, but they can’t compel people to use them if teams choose to go around systems.
Slack and Microsoft Teams, attaining immediate communication without any email formality or meeting scheduling, are 88% adopted now [Communication tools data].’ Quick questions, urgent problems, and informal working relationships are all naturally enabled by persistent chat channels.’
Messaging practices:
Channels are where the core discussions take place on Twake: with its higher level of organization, channels make it easier to break down conversations by project, team, topic, or client without it turning into the chaotic “all in one place” situation. Channels provide a means of selective participation and focused discussion.
Threaded conversations preserve the context of the discussion rather than mixing several conversations for the sake of confusing interleaving. Threads keep channels scannable while maintaining the depth of discussion.
@mentions and notifications help focus attention on one or more people when needed, specifically for input, in the midst of a deluge of messages. But too many notifications can lead to notification fatigue, which reduces their utility.’
Integration with tools: Automated notifications from GitHub, Jira, monitoring systems, and deployment pipelines are posted to the right channels, bringing your information flow into one place. Teams stay informed via ambient notification. All Teams have ambient notification keeps you in sync with your team, so you can focus on your work without worrying about missing conversation updates.
Real-time troubleshooting leads to quick exchange, and blockers are eliminated within minutes rather than email ping-pong for hours or days. Instant messaging is especially useful for distributed teams lacking hallway conversations.
But there is no question that the risks of message overload are real – with repeated interruptions that break concentration, important information lost in the stream of chat messages, and decisions documented being lost in the history of chats. Managing accessibility vs focus has to involve agreeing on response time and documentation norms.
Zoom and Microsoft Teams account for 90% of use when face-to-face interaction was needed to build trust, interpret non-verbal communication, or to participate in high-stakes discussions [Communication tools data]. Video is especially needed for distributed teams that do not share a common physical space.
Tips for Successful Video Meetings:
Daily stand-ups also help synchronize distributed teams performing brief video check-ins with reports on what they’ve done, what they’re working on, and what, if anything, is preventing them from making progress. Seeing co-workers creates more connection than audio-only calls.
Sprint ceremonies such as planning, reviews, and retrospectives can be held over video, allowing teams to estimate together, attend demo sessions, and facilitate discussions. Screen sharing also allows you to collaborate on artifacts.
Discussions on architecture can take advantage of video for rapid sketching, diagram annotation, and collaborative work on detailed and advanced technical designs. Visual communication simplifies many things you try to write [based on ‘Things That Are Hard To Write!’].
Managers hold one-on-ones with employees to chat about feedback, career growth, and any other personal matters that require a one-on-one, private conversation. Video fosters better relationships than text-based communication.
Capturing and transcribing, keep meeting context relevant for team members who were not there or for later use with the help of AI-enabled tools such as Otter.ai. Action items and decisions are extracted from the automated summaries.
Moderate effect on quality and schedule: Video’s auxiliary nature – it facilitates collaboration rather than being directly responsible for producing work deliverables [Communication tools data]. But the video communication foils miscommunication that can stop projects dead in their tracks.
GitHub and GitLab have become the default solutions (with 95% usage) for version control, code review, and collaboration as essential infrastructure [Communication tools data]. These tools are not only for storing code; they allow for distributed development workflows such as branching, merging, and reviewing.
Repository workflows:
Feature branches are used to keep work in progress separate from the main codebase and allow for parallel development without conflicts. Developers develop independently and merge completed work through a controlled process.
Pull requests are a way of formalizing code review processes; they require approval before merging changes to a protected branch. PRs offer gates for quality, opportunities to share knowledge, and to collaborate on features.
Code review takes place through PR interfaces that allow for line-by-line comments, change requests, and approval workflows. Asynchronous review allows for distributed teams working in different time zones.
Linting, testing, and analysis are all automated checks on every commit through CI/CD integration; these give us immediate feedback. Automation can detect issues missed by reviewers, and also unlocks human review to focus on design and logic.
Tracking issues links commits to tickets so they have traceability from requirements to implementation. History tells why a change was made, it helps to maintain it in the future.
Critical impact on both quality and schedule reinforces the importance of the repository [Communication tools data]. A well-managed repository allows productive collaboration among multiple users, whereas a neglected repository generates confusion and squabbling among them!
Confluence and Notion are almost equally adopted at more than 75% in both, with Confluence being in the lead, for collaborative documentation in architecture, processes, onboarding, and operational knowledge [Communication tools data]. Unlike code comments, centralized documentation includes big-picture context and cross-cutting knowledge.
Contents of documentation:
Architecture documentation describes the system design, technology stack used, integration patterns, and deployment architecture with the help of diagrams and text. New employees understand the system’s human without needing to do a lot of code spelunking.
Process documentation documents team workflows, coding standards, deployment procedures, and incident response runbooks. Documented procedures facilitate uniform application and incremental refinement of them.
API documentation includes details such as interfaces, request/response formats, authentication, and examples that enable the integrator to use and engage the API without having to engage the API developer repeatedly. Well-documented APIs enable faster integrations.
New team members help establish the environment setup, architecture, processes, and get up to speed quickly. Onboarding guides help. The sum up is that: solid onboarding means less time wasted trying to find your bearings on the job. Understanding these parts is essential for new employees to grasp the philosophy of our work and provide efficient service.
Comprehensive onboarding reduces ramp-up time from months to weeks.
Record decisions, save architectural decisions, rejected alternatives, and reasoning for future reference. History of the decision: Avoid re-discussing these matters when the environment changes.
Medium impact to quality and timeline as documentation is only indirectly valuable—it doesn’t deliver features, but it allows teams to collaborate efficiently [Communication tools data]. Yet poor documentation was the source of frequent disruption and attrition of institutional knowledge.
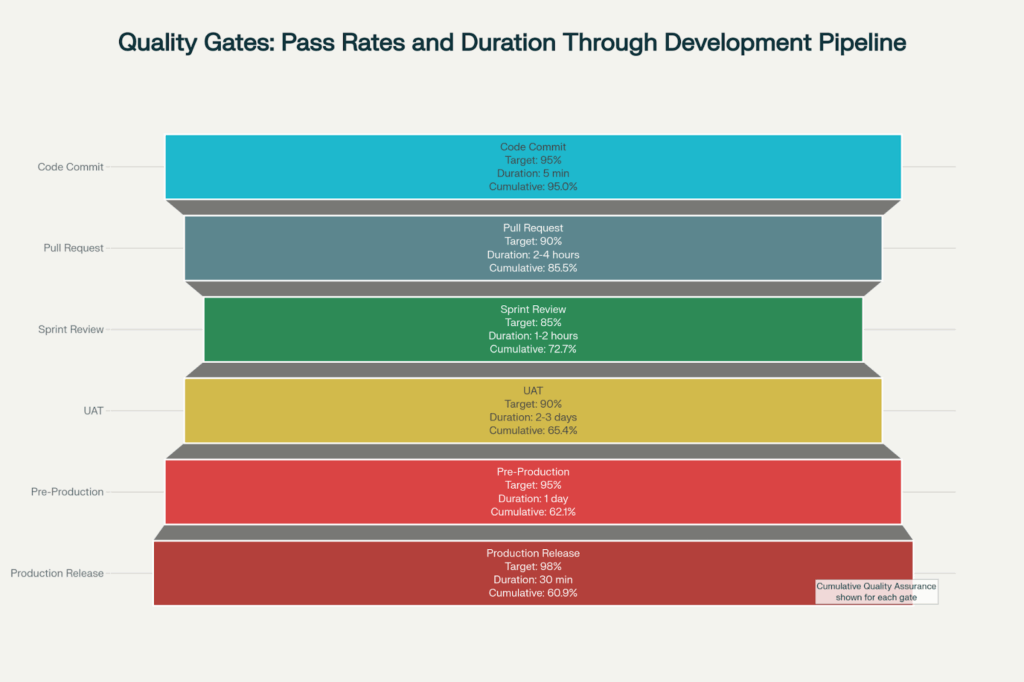
Production releases pass through six quality gates with a success rate of 98% which includes code commits from 5/minute (with a 95% pass rate) and UAT cycles of several days (90% pass rate).
Quality gates are a series of mandatory stop points built into development pipelines that block defects from moving forward to later stages without slowing down the pace of development. Each gate includes automated validation and human interpretation to provide a full quality view.
Code commit gates are processed at 5 minutes with a 95% pass rate and enable quick response to very basic quality criteria [Quality gates data]. These automated tests are run on every commit to prevent mistakes from entering shared repositories, so you’ll be notified immediately if you’ve made a dumb error.
Commit gate automation:
Linting and formatting help you maintain KISS code style rules to avoid unwanted surprises about code formatting, variable naming, and other construct usage [Quality gates data]. Automation formatting prevents such bikeshedding conversations and ensures the text remains readable.
Unit test runs execution is affected by changes. All unit tests that are affected by changes are executed to ensure they pass, and that you haven’t really introduced breaking changes [Quality gates data]. Quick unit tests run in seconds and give you immediate feedback if you’ve caused any regressions.
Simple security scanning scans for known vulnerabilities in dependencies, hardcoded secrets, or dangerous code patterns [Quality gates data]. Early security checks prevent known risks from being introduced.
Build verification: Check that the code builds without error, dependencies can be resolved, and the simplest of sanity checks pass [Quality gates data]. Break the build, block the commit, prevent the spreading of broken code through the repository.
The 95% success rate means that most commits satisfy minimal quality requirements thanks to pre-commit verification and developer discipline [Quality gates data]. Failing commits make the repository dirty, but they shouldn’t be too frequent if developers run tests locally before committing.
Pull request gates aim for 90% pass rates and 2-4 hour review cycles, using a combination of automated analysis and human code review [Quality gates data]. This is the gate that finds logic errors, architecture problems, and shedding knowledge opportunities that these automated tools are blind to.
PR review process:
Automated coverage analysis ensures that new code is sufficiently tested and blocks untested code from getting in [Quality gates data]. Coverage thresholds (commonly ~80%) promote testability.
Complexity analysis detects overly complicated code by flagging when the code exceeds predefined cyclomatic complexity thresholds [Quality gates data]. Complexity boundaries preserve maintainability.
A peer review also looks at correctness, readability, quality of design, and whether patterns are consistently applied. Human testers can review what automated testing cannot.
Review checklists provide a consistent framework for evaluating functionality, security, performance, maintainability, and testing. Checklists let you be sure that you are as thorough with each of you as with the next.
The requirement for approval is that it requires one or more approvals from reviewers before merging, so that the changes have been validated by two or more developers. Required approvals prevent a developer from committing changes to important code without review.
The 90% pass rate is indicative of the norm iteration – the majority of a PR will have comments and need to be tweaked before it’s eventually approved [Quality gates data]. Review rounds for improvements without losing flow.
Sprint reviews gates have an 85% pass rate within 1 – 2 hour demo sessions and demonstrate that done work fulfills the acceptance criteria prior to treating features as “done” [Quality gates data]. Stakeholder feedback on reviews stops you from delivering what they don’t want to be doing.
Review operation:
Live demos of running software in real-life situations show the software doing exactly what they do in their jobs [Quality gates data]. Demos demonstrate that the functionality really works when we rely on what developers say.
Validation of the acceptance criteria. Confirmation systematically verifies each of the acceptance criteria of a requirement and checks whether it can objectively be considered as passed or failed [Quality gates data]. Clear criteria erase subjective discussions about quality.
Responding to stakeholder feedback collects reactions, surfaces issues, and captures ideas for improvements while the function is still fresh [Quality gates data]. Early feedback allows for early corrections.
Definition of done review: The Definition of Done review verifies that all quality aspects (tests, documentation, deployment) are satisfied before the story is accepted [Quality gates data]. Partially done work does not count in velocity. ”
It translates an 85% pass rate as items that were accepted, but were adjusted somewhat, or tested a bit more, or the acceptance criteria were clarified somewhat before the final acceptance [Quality gates data]. Some iteration is discovery in validation rather than quality.
UAT gates strive to achieve 90% pass rates over 2-3 day validation windows to receive the final business sign-off prior to production deployment [Quality gates data]. UAT is the final chance to catch requirement misalignment or usability problems on the cheap.
Execution of UAT:
Business user testing is where the actual end users conduct realistic scenarios in a production-like environment [Quality gates data]. When testing with real users, messiness and workflow fail points pop up that developers don’t find.
Test scripts are used to walk you through scenarios such as the most common use cases, the less common use cases (edge cases), and error conditions [Quality gates data]. Comprehensive coverage is ensured by scripted testing, and this can be combined with exploratory testing as well.
Defect documentation: The defect report holds the bugs found during UAT and includes severity, steps to reproduce, and how it affects the business [Quality gates data]. Concise defect reporting allows for timely triaging.
The go/no-go decisions are based on sign-off criteria for critical defect (0), major defect (5), and minor issue (20), to specify the threshold of the number of critical defects, major defects, and minor issues [Quality gates data]. Objective standards avoid endless testing.
The 90% pass rate is an indication that the majority of functionality is in ok shape by the time it gets to UAT, with just a few tweaks needed before getting the thumbs up [Quality gates data]. Better pass rates are indicative of higher quality in the earlier phases of development.
Pre-production gates have a 95% success rate in 1-day validation cycles, performing one last technical check prior to production release [Quality gates data]. This gate verifies deployability, performance testing, and security review.
Pre-production checks:
Performance testing confirms response times, throughput, and resource usage during normal and peak loads [Quality gates data]. Performance issues caught here avoid production incidents.
A full vulnerability assessment, penetration test, and compliance check are performed on Security scanning [Quality gates data]. Final security validation prior to exposure to the public.
Deployment validation validates the deployment process, rollback process, and infrastructure configuration in staging or production-like environment(s) [Quality gates data]. Deployment rehearsals catch procedure errors.
Monitoring ownership Tests, alerting, logging, dashboards, observability tooling, SOX, etc., are working properly prior to release [Quality gates data]. Operational readiness = can you nuke it when it snuffs out incident response capability?
The 95% pass rate is indicative of well-established pre-production processes, and most of the problems are identified sooner [Quality gates data]. Items that fail here usually are environment-specific configurations, not application-level defects.
Production release gates aim for a 98% pass rate, finishing in 30-minute windows, performing final checks prior to customer exposure [Quality gates data]. This gate is critical for making sure only validated, monitored deployments go live.
Release verification:
Smoke testing executes critical path scenarios immediately post-deployment, verifying that critical functionality is working [Quality Gates Data]. Brief smoke tests check for deployment failures prior to affecting large numbers of customers.
Deployment checklist that guarantees all steps of the release—for example, database migrations, configuration updates, cache clearing, feature flag configurations—have been done in a systematic manner [Quality gates data]. Checklists prevent mistakes.
Monitoring validation ensures the alerts work, the metrics flow, and the dashboards are showing up-to-date data [Quality Gates Data]. Monitoring must be considered to be functioning prior to considering the deployments successful.
Rolling release deploys to a subset of users, and watches for problems before wider release [Quality gates data]. Broke deploy dithers Rollout Stages us up Broad Rollouts. If something goes wrong.
The 98% pass rate today speaks to very high deployment reliability throughout the first several gates due to automated deployment practices and high quality earlier gates [Quality gates data]. Failures tend to be related to environment-specific problems rather than code defects.
Timeline and quality delivery management when offshoring software development to India need to be embedded in end-to-end processes that include established methodologies, strong QA, clear communication, and stringent monitoring. As 65% of Indian companies follow Agile-Scrum, with testing methodologies covering maturity levels up to 80% code coverage and performance metrics that are comparable with or better than global standards, organizations can take full advantage of India’s large pool of technical experts and still maintain control of project success.
The key to success includes the use of suitable project management methodologies which correspond to the properties of the project, quality insurance on several levels from unit testing to UAT, regular communication on a cross-tool and time zone basis, and monitoring actionable KPIs which can signal in an early stage if there is any risk related to timeline or quality.
Mitigation strategies for risk include mitigation of common threats via change control instead of scope creep, detailed requirements to remove ambiguity, knowledge documentation to reduce turnover effect, refactoring on a regular basis to manage technical debt, and continuous integration to catch compatibility concerns early.
Quality gate enforcement establishes turnstiles from code commits to production releases, yielding 95-98% in passing rates through layered validation that involves automated checks and human-based reviews. Each gate identifies different types of defects and allows the development pace to be sustained by streamlined methodologies.
The tool ecosystem adoption process, including project (Jira/Asana), communication (Slack/Teams/Zoom), version control (GitHub/GitLab), and documentation (Confluence/Notion), establishes a future-proof infrastructure that facilitates distributed collaboration across geographic and temporal lines.
Success is contingent on seeing the Indian development partners as strategic partners, and not transactional vendors, and investing in relationship building, mutual understanding, and continuous process improvement that creates a positive compounding effect over time. With the right frameworks in place, governance in place, and a mindset as partners, the value organizations achieve working with Indian software development is nothing short of amazing while still delivering predictable timelines and quality that meet even the most demanding requirements.