The majority of founders compare hourly rates to determine the return on investment for offshore development. Not only is that lacking, but it is also deceptive. Businesses that achieve 40–60% return on investment in six months in 2024–2025 realize that complete frameworks that track financial, operational, and strategic returns throughout the engagement lifecycle are necessary for accurate ROI measurement.
Before hidden costs surface, the advertised $25–45 per hour for offshore developers seems alluring. An analysis of more than 200 offshore projects shows that businesses save an average of 52%, which is much less than the 60–70% that hourly rate comparisons alone would indicate.
The void? Hidden costs increase baseline costs by 15–25%, while quality rework accounts for 15–25% of project costs, communication delays add another 15–20%, and prolonged onboarding costs 15–30% more than expected.
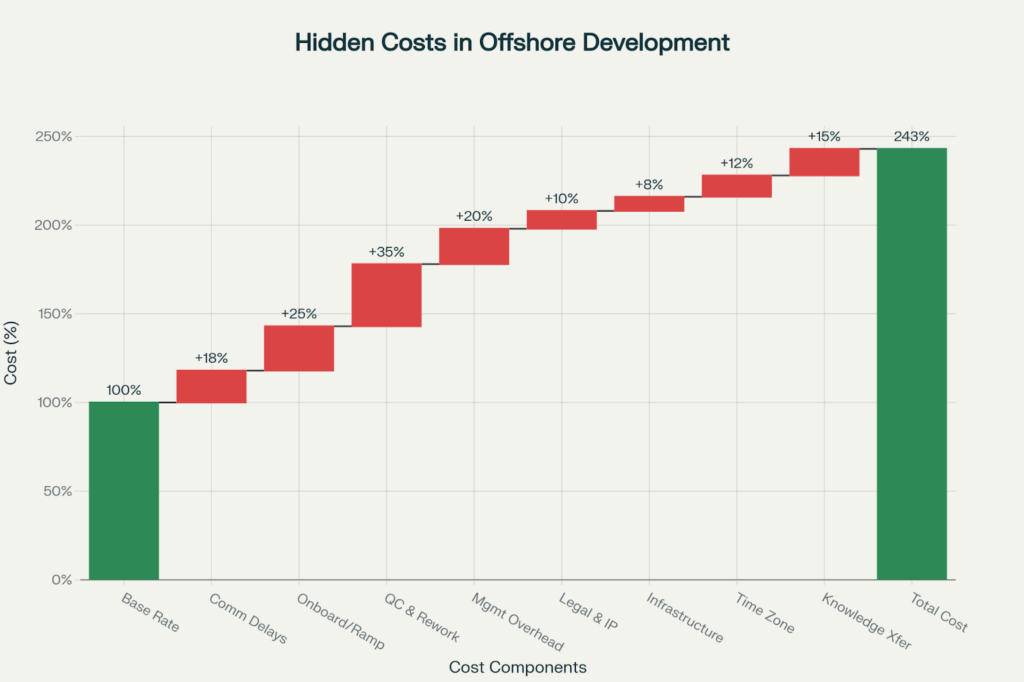
Offshore Development Hidden Costs: Base Rate to True Cost (2025)
When accounting for communication delays (18%), onboarding (25%), quality rework (35%), management overhead (20%), legal protection (10%), infrastructure (8%), time zone coordination (12%), and knowledge transfer (15%), the total true costs, starting from a baseline hourly rate, reach 143-243% of advertised rates.
To capture various facets of offshore ROI, sophisticated businesses employ a variety of calculation techniques.
While simple ROI makes comparisons fast, it ignores external factors and the time value of money. Net Present Value (NPV) provides 90% accuracy for long-term investments by taking into consideration risk factors such as exchange rate fluctuations and the timing of future cash flows.
Whereas annualized ROI makes clear the yearly returns for multi-year engagements, Internal Rate of Return (IRR) makes it possible to compare several offshore options with different cash flow structures. The most thorough picture is provided by Total Cost of Ownership (TCO), which takes 60 minutes to calculate but has a 90% accuracy rate.
Accurate ROI measurement and cost optimization depend on knowing where money is going.
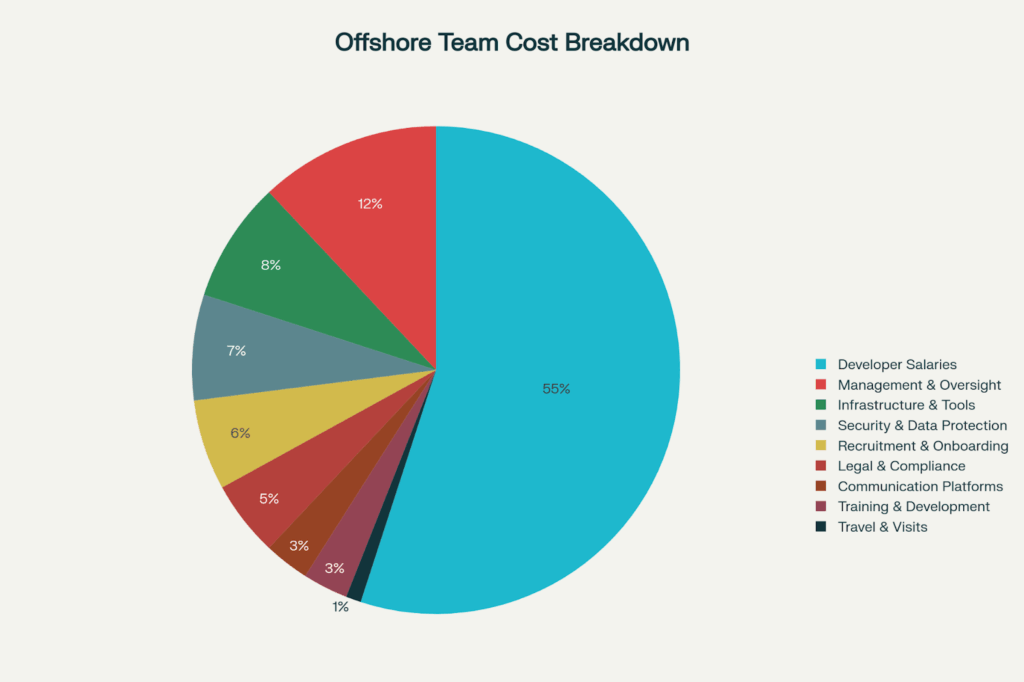
Total Cost Breakdown: Offshore Development Team of 15 (2025)
Developer salaries account for 55% ($71,500/month) of the cost of an offshore team of 15 people, while management overhead adds 12% ($15,600), infrastructure 8% ($10,400), and security 7% ($9,100). The picture is completed by hiring and onboarding (6%), legal compliance (5%), communication tools (3%), training (3%), and travel (1%).
Only if optimization opportunities are taken advantage of, such as 30% savings on communication platforms, 25% on recruitment, 20% on infrastructure and training, and 15% on management, does this $130,000 monthly investment stand in stark contrast to the $260,000+ for equivalent onshore capacity.
Half the story is revealed by financial ROI. Operational KPIs show whether offshore teams create hidden liabilities or long-term value.
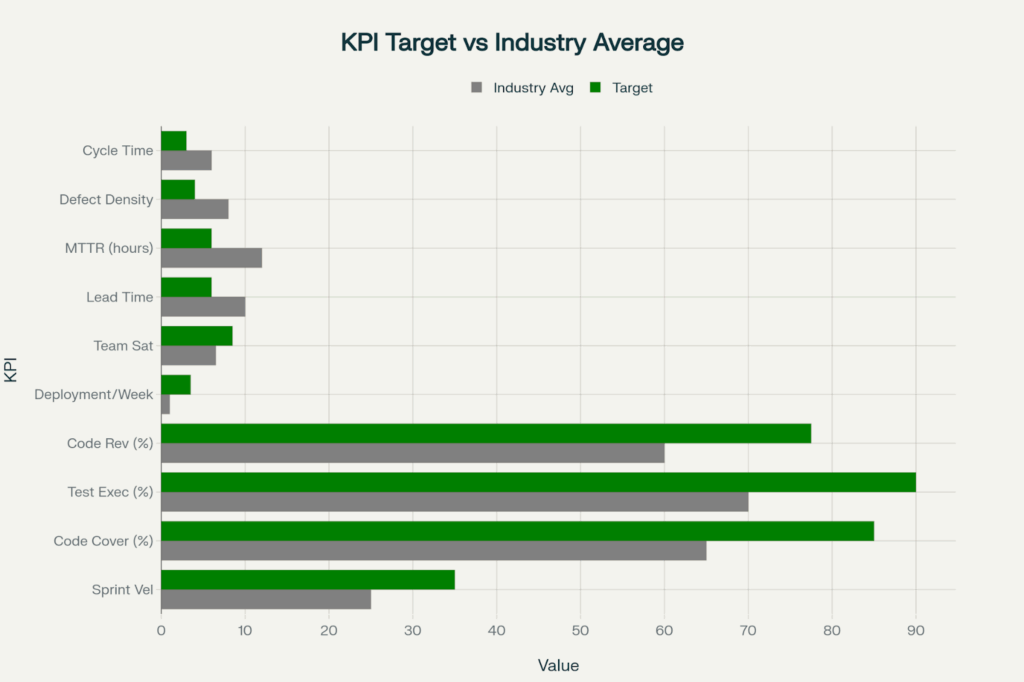
Offshore Team Performance KPIs: Industry Average vs. 2025 Goals
High-performing offshore teams maintain 3-5 defects per KLOC compared to the industry standard of 8, reach 80-90% code coverage compared to the average of 65%, and hit 30-40 story points sprint velocity compared to the industry average of 25.
Operational velocity is measured by lead time (5-7 days vs. 10), deployment frequency (2-5 per week vs. 1), and mean time to resolution (4-8 hours vs. 12). Quality and sustainability are demonstrated by the test execution rate (85-95% vs 70%), code review effectiveness (70-85% vs 60%), and team satisfaction (8-9/10 vs 6.5/10).
Businesses that monitor these indicators spot engagement risks, quality deficiencies, and productivity snags before they affect return on investment.
ROI is directly impacted by quality through technical debt, customer attrition, and rework expenses. Rigid quality measurement distinguishes profitable offshore collaborations from costly errors.
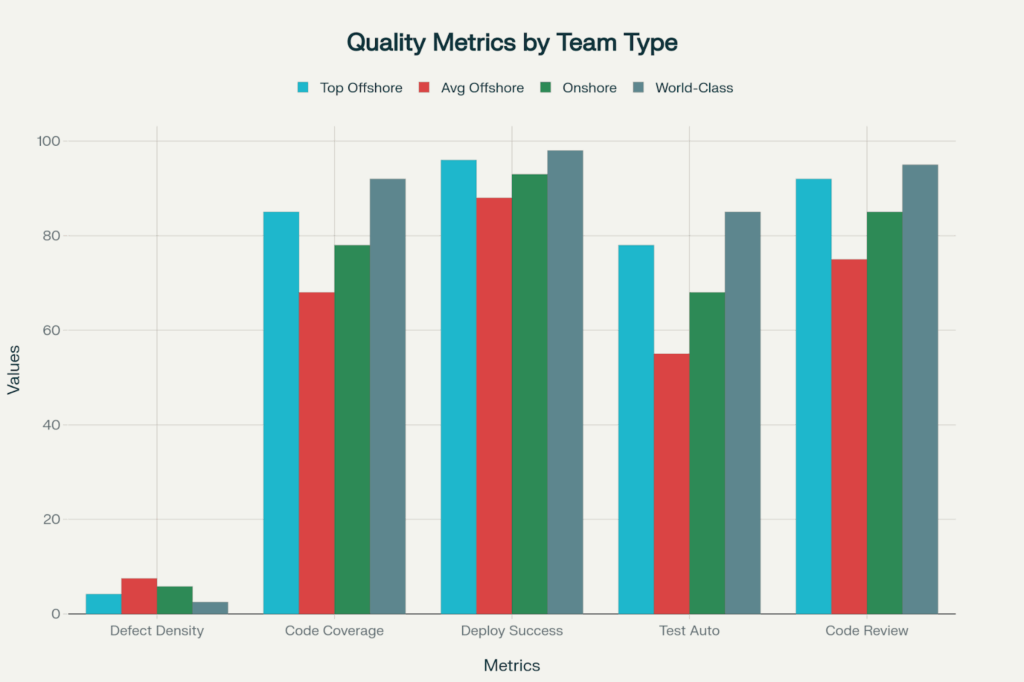
Comparing Quality Metrics: World-Class, Offshore, and Onshore (2025)
The top offshore teams attain 4.2 defects per KLOC, which is close to the world-class 2.5 and better than the onshore average of 5.8. Deployment success is 96% versus 93% onshore, and code coverage is 85% versus 78% onshore.
Code review coverage (92% vs. 85%), critical bug resolution time (6 hours vs. 10 hours onshore), and test automation coverage (78% vs. 68%) show that well-managed offshore teams can meet or surpass onshore quality standards.
The fact that average offshore teams lag so badly—7.5 defects per KLOC, 68% code coverage, 88% deployment success, and 18-hour bug resolution times—makes it clear that vendor selection and management procedures have a direct impact on ROI results.
Offshore teams take time to deliver complete value. Realistic expectations are set and premature ROI assessments are avoided when one is aware of the maturation timeline.
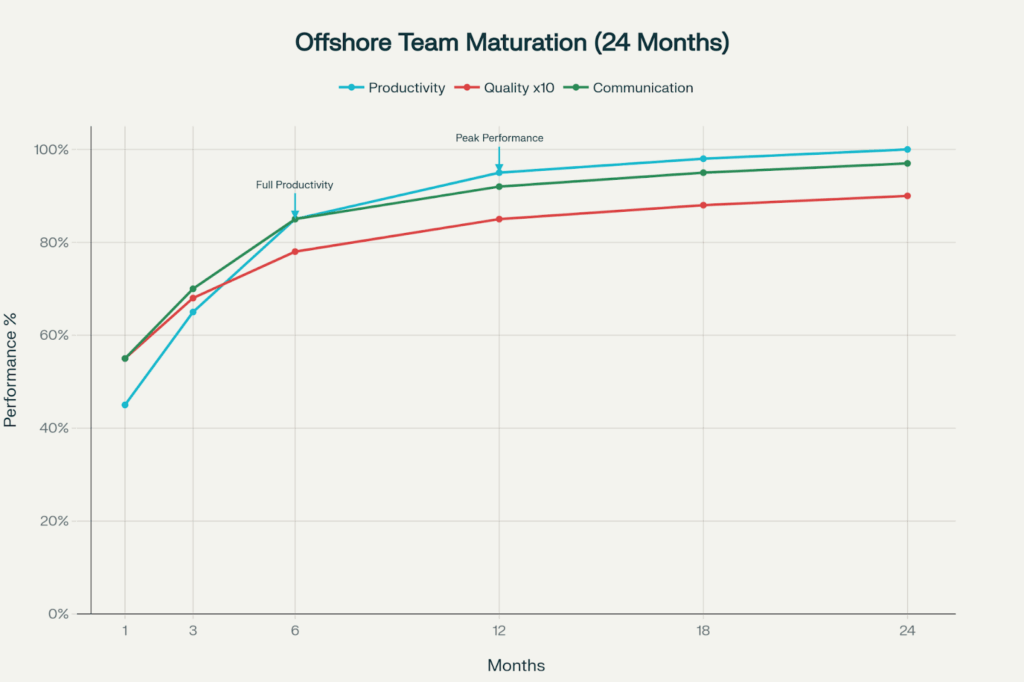
Productivity Maturation Curve for Offshore Teams (15-Person Team, 2024-2025)
Month 1: Teams operate at 45% productivity with 5.5/10 quality scores and 55% communication efficiency. Setup costs only, no cumulative savings yet.
Month 3: Communication reaches 70%, quality rises to 6.8/10, and productivity reaches 65%. For teams of 15 people, the first $95K in savings builds up.
Month 6: 85% communication, 7.8/10 quality, and full productivity. When total savings reach $285K, the true return on investment is apparent.
Month 12: 92% communication, 8.5/10 quality, and peak performance (95% productivity). $720K in total savings.
Month 24: 97% communication, 9.0/10 quality, and maximum optimization (100% productivity). A total of $1.75 million was saved.
This curve explains why payback periods fall between three and four months, and by the sixth month, a positive return on investment starts to accumulate. Businesses that evaluate ROI prior to month six tend to underestimate long-term value.
Because of economies of scale, lower overhead costs per developer, and quicker break-even, offshore development ROI significantly increases with team size.
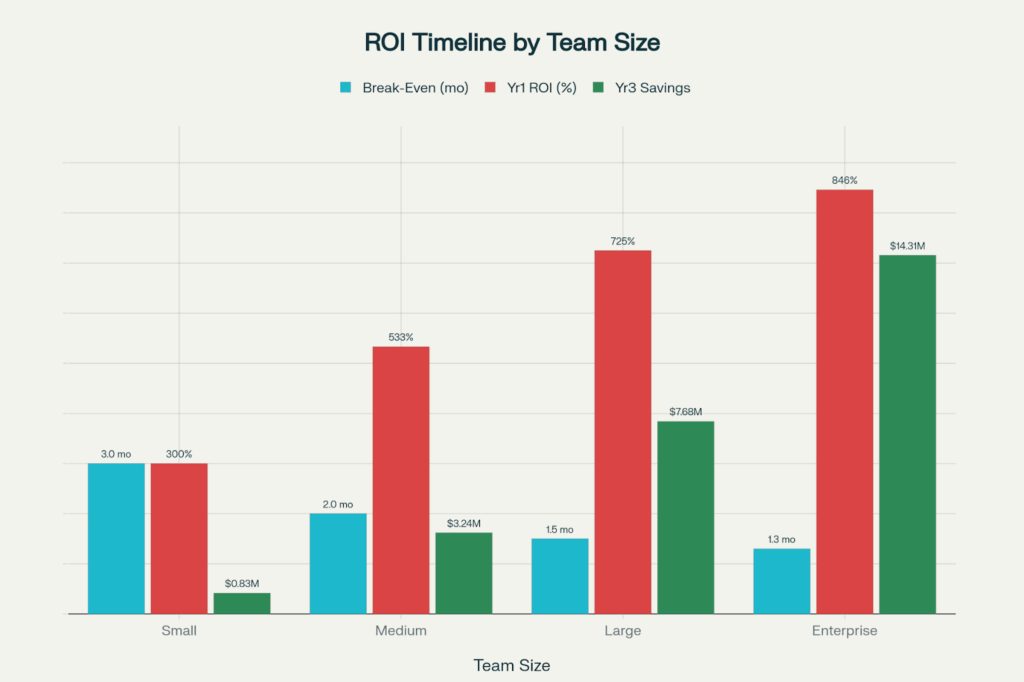
ROI for Offshore Development by Team Size: Break-Even and Returns (2024-2025)
Small teams of five developers break even in three months, save $25K a month, and need a $75K setup investment. ROI in Year 1: 300%. Total savings over three years: $825K.
Medium teams of 15 developers require $180,000 to set up, generate $95K in savings each month, and break even in two months. ROI in Year 1: 533%. Savings over three years: $3.24 million.
Large teams (30 developers) break even in 1.5 months after investing $320,000 up front and saving $220,000 per month. ROI in Year 1: 725%. Savings over three years: $7.68M.
Enterprise teams (50+ developers) break even in 1.3 months, save $410K a month, and spend $550K on setup. ROI in Year 1: 846%. Savings over three years: $14.31 million.
Offshore development is becoming more and more alluring at scale due to the non-linear scaling of ROI, which means that doubling team size more than doubles returns.
Today’s offshore ROI measurement takes competitive advantages, market access, and strategic capabilities into account in addition to financial returns.
Hidden ROI is represented by speed to market: developing an MVP 37.5% faster results in earlier revenue, quicker validation, and competitive positioning. Rapid experimentation and market responsiveness are made possible by feature velocity increases of 85%, which are far more valuable than hourly rate reductions.
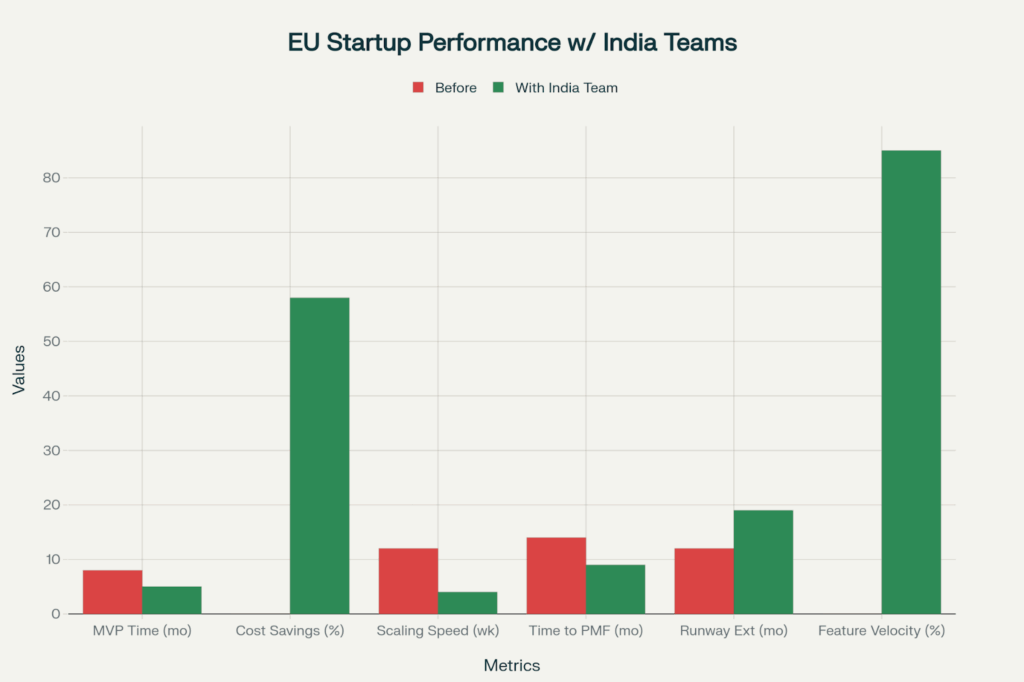
Comparing the Performance of European Startups Before and After Hiring Indian Teams (2025)
Strategic value is created by talent access: innovation projects that would otherwise be impossible are made possible by gaining access to specialized AI/ML, blockchain, and cloud expertise that is not available locally. When strategic capabilities are valued alongside cost reductions, studies show a 231% return on investment in some industries.
Scalability offers flexibility: in high-growth scenarios, the ability to scale teams from five to fifty developers in four weeks as opposed to twelve weeks for local hiring creates strategic flexibility worth millions.
It is challenging to measure the insurance value of risk mitigation through geographic diversification, round-the-clock development cycles, and decreased reliance on a single talent market, but these strategies are essential for resilience.
Disappointing offshore engagements are distinguished from high-ROI ones by identifying and reducing hidden costs.
Language hurdles, cultural differences, and asynchronous workflows are the main causes of communication delays (18% cost addition). Mitigation difficulty: 6/10; overlap hours, communication protocols, and collaboration tools must be invested in.
Time to full productivity and knowledge transfer are reflected in the 25% addition for onboarding and ramp-up. Mitigation difficulty: 8/10; requires mentorship, documentation, and organized onboarding programs.
The biggest hidden cost, quality control and rework (35% addition), is caused by ambiguous requirements, inadequate supervision, and skill mismatches. Mitigation difficulty: 9/10, necessitating ongoing feedback loops, code reviews, and strong QA procedures.
Management overhead (20% addition) covers project management, coordination, and governance. Mitigation difficulty: 7/10; clear procedures and seasoned offshore managers are required.
Contract negotiation, compliance, and intellectual property protection are covered by legal and IP protection (10% addition). Mitigation difficulty: 5/10; standard agreements and knowledgeable legal counsel were used to resolve it.
Businesses that proactively handle these hidden costs during setup and management see higher returns on investment than those that learn about them after the fact.
A thorough ROI measurement is demonstrated by a Series A SaaS startup that employs a 15-person offshore development team in India.
Setup costs total $95K, which includes hiring ($35K), legal setup ($15K), infrastructure ($25K), and onboarding ($20K).
The monthly expenses come to $130K, which includes developer salaries ($71.5K), management ($15.6K), infrastructure ($10.4K), security ($9.1K), and other ($23.4K).
Onshore Baseline Comparable: $260K per month—$3.12M per year.
Annual Offshore Cost: $1.56M + $95K setup = $1.655M.
Simple ROI for Year 1: [($3.12M – $1.665M) / $1.665M] × 100 = 87%.
Including the Productivity Ramp, the effective productivity for Year 1 is 82%, with Months 1-3 operating at 55% efficiency, Months 4-6 operating at 75%, and Months 7-12 operating at 95%. ROI adjusted: 65%.
Including Hidden Costs: rework ($455K), management overhead ($260K), communication delays ($280K), and other ($195K) = $1.19M extra. The actual first-year cost was $2.855 million. ROI adjusted: 9%.
Years 2-3 Optimization: 100% output, 10% rework reduction (10% vs. 35%), and management optimization (8% vs. 12%) equal $1.82M in annual expenses. ROI for years two and three: 71%.
This illustrates why multi-year horizons, productivity curves, and thorough cost modeling—rather than merely hourly rate comparisons—are necessary for accurate ROI measurement.
1. Select the appropriate pricing structure: Time-and-materials for changing needs, fixed pricing for clearly defined projects, and committed teams for enduring collaborations. Flexibility and cost control are balanced in hybrid models.
2. Monitor thorough KPIs right away: ROI trajectory is more accurately predicted by sprint velocity, defect density, deployment frequency, team satisfaction, and communication effectiveness than by financial metrics alone.
3. Make a significant investment in onboarding: Organized programs that last four to six weeks shorten the time to full productivity and lower the 25% hidden cost of prolonged ramp-up.
4. Create strict quality procedures: Code reviews, automated testing, and continuous integration stop rework, the biggest ROI killer, from adding 35% to costs.
5. Employ seasoned offshore managers: Organizations with committed offshore program managers see a 40% increase in return on investment (ROI) as a result of improved communication, quicker problem solving, and proactive risk management.
6. Budget for 12–18 month commitments: ROI fully materializes after 12–18 months, with payback periods of 3–4 months plus 6–8 months to full productivity. Full value is rarely captured by shorter engagements.
7. Go beyond cost reductions to gauge strategic value: Geographic diversification, faster time-to-market, 24/7 development cycles, and access to specialized skills frequently outweigh direct financial savings in terms of overall value creation.
Driven by demonstrated return on investment across all company sizes and industries, the offshore software development market reached $160.9 billion in 2024 and is expected to reach $413 billion by 2033.
ROI calculations are changing as a result of AI and automation: The productivity of offshore teams is increased by 30–40% over 2023 baselines thanks to AI-powered code generation and testing, which accelerates return on investment for businesses using these tools.
By shifting the emphasis from hours to deliverables, outcome-based pricing models match vendor incentives with client return on investment. Businesses that use these models report more consistent ROI results and 20–25% higher client satisfaction.
Leading companies have found that hybrid offshore-nearshore-onshore models preserve 90%+ time zone overlap for customer work while simultaneously optimizing cost, quality, time zones, and strategic control.
Only when measured and managed thoroughly can offshore development yield a true return on investment. Although they are not guaranteed, 52% average cost savings, 40–60% ROI in 6 months, and payback periods of 2-4 months are attainable.
Success necessitates patience through 6-month productivity ramps, investment in quality processes that prevent 35% rework costs, realistic expectations regarding hidden costs (adding 15-20% to baselines), and thorough KPI tracking that goes beyond financial metrics.
The evidence is clear: through cost savings, speed advantages, and strategic capabilities, well-executed offshore engagements yield transformative return on investment. False savings from poorly managed engagements eventually evaporate due to unstated expenses and poor quality.
In 2025, founders will need to measure true return on investment (ROI) by tracking total costs, operational KPIs, quality metrics, productivity maturation, and strategic value—and managing each of these elements meticulously from the start.