
In 2025, the rate of startup failure is still high. 60% of startups fail in 3-5 years. The main reason is not that features are executed badly—it’s that they’re building products that no one wants. Teams labor for months on rolling out code for products that address make-believe issues, or that solve real problems in ways users don’t value.
The distinction between successful companies and those that are not often is not having more engineering talent or more money. It’s whether they did product thinking before they did engineering. It’s whether they tested the key assumptions with real users before they spent development dollars. Whether it’s that they remained customer-obsessed or became a feature factory.
This article demonstrates how top product engineering companies in India—providers such as Ateam Soft Solutions and others that demonstrate product thinking in conjunction with technical excellence—ensure that they build the right product before building it well. Rather than “build fast, fix later,” they “validate first, build fast, iterate systematically.”
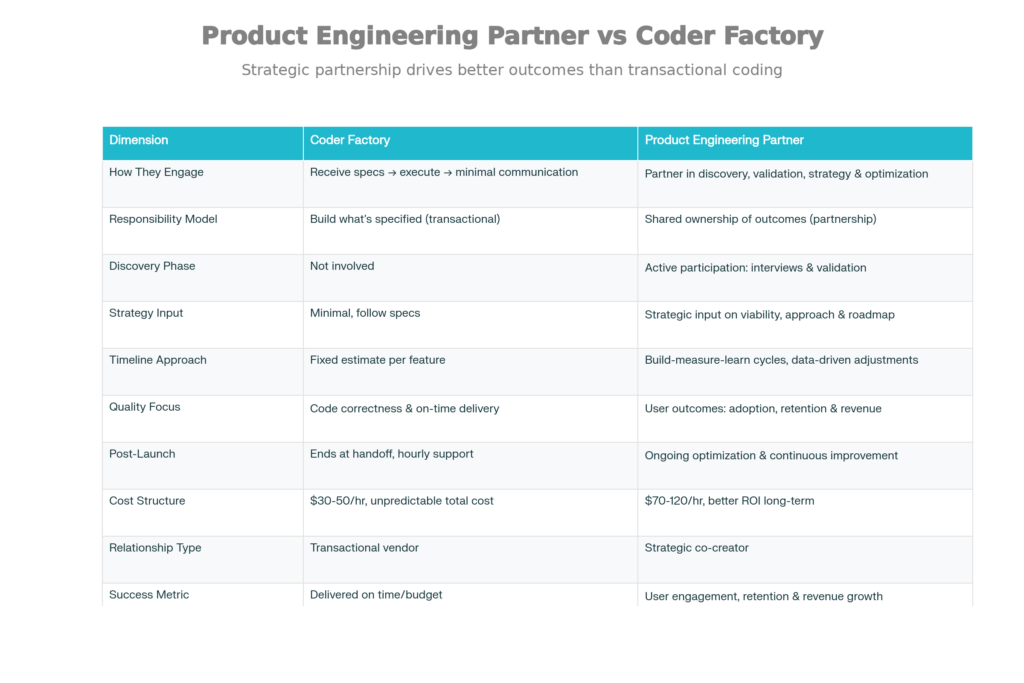
Coder Factory vs. Product Engineering Partner: Comparison of Capabilities and Business Models
The difference between a “coder factory” and a “product engineering partner” is night and day. Both result in working software. Only one ensures the software addresses actual needs.
Coder Factories run on a straightforward model: take specifications, build to specification, deliver code. Responsibility for that ends at handoff. Cost is billable per hour. The relationship is transactional.
Product Engineering Partners operate on a wholly different model: They research and empathize with the problem space, they test assumptions with users, they co-design solutions, they build iteratively, and they post-launch optimize based on actual usage data. Accountability is mutual in results. Value is measured in user engagement, not lines of code shipped. A relationship is a partnership.
The contrast is clear: coder factories generate code; product engineering partners develop products that people use.
Why This Stage Matters:
60% of product features are used infrequently or not at all. This waste happens because firms build features on assumptions rather than validated customer needs. Leading product engineering companies dedicate 20-30% of the project timeline to discovery, avoiding months of wasted development.
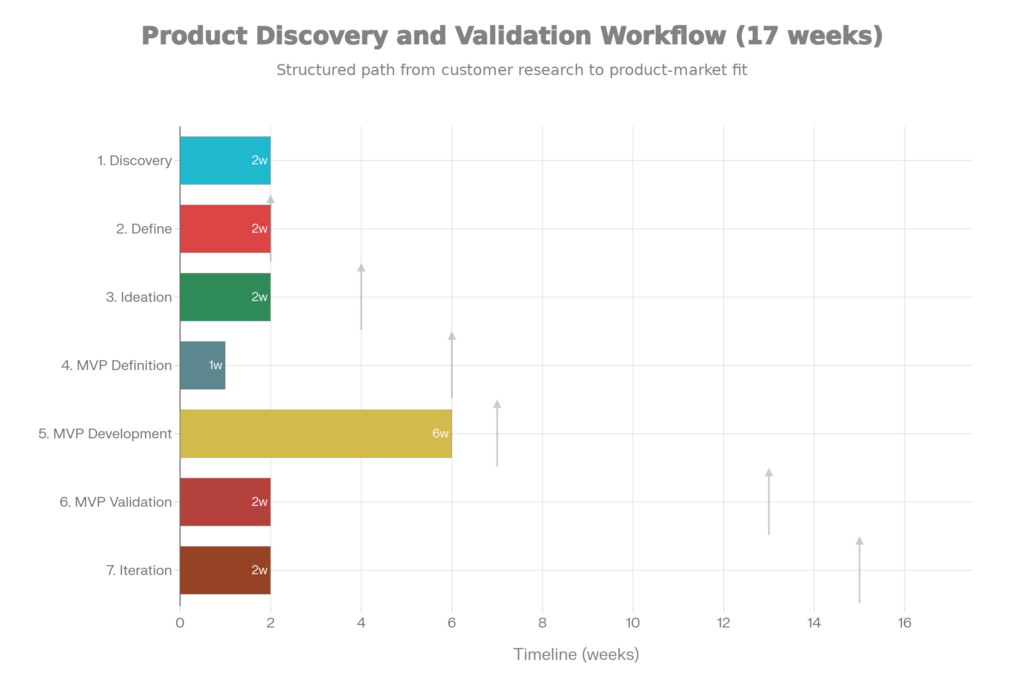
Product Discovery to Validation: A Seven-Step Process for Developing the Ideal Product
Customer Interviews are the bedrock of discovery. But most teams get them wrong—they come in with a fixed notion and throw leading questions at interviewees that confirm their bias instead of unearthing customer truth.
1. Target the Right People (Not Your Existing Customers):
Early discovery should be aimed at people who have the problem and who are either have not solved it yet, or have solved it poorly. When you ask your current happy customers, “Why do you use our product?” the insights you get are very different from the ones you get when you ask frustrated prospects, “What keeps you from solving this problem?”
Hiring: Leading firms hire 10-20 target users for initial interviews via:
2. Make Open-Ended, Investigative Questions (Avoid Leading Questions):
❌ Poor Interview: “Don’t you think our payment feature would save you time?”
✅ Excellent Interview: “Walk me through how you currently handle payments. What’s frustrating about that process?”
The first one guides the buyers, and the second one allows them to reveal their truth.
Interview Questions for Big Companies:
3. Listen for Emotional Language (Which Means Actual Pain):
When customers complain, “it’s annoying,” or “it’s a hassle,” it actually signals problems. Emotional words tell you what actually matters to them, not what you think they should care about.
4. Talk to 10-20 People Minimum:
Patterns will start to develop after around the 10th interview. At 15-20 interviews, the same problems keep popping up (law of diminishing returns). The right number of interviews is 10-20 — enough to identify real patterns, not so many that you’re gathering vanity data.
5. Get Your Whole Team to Interview:
Not just the PM. Designers, engineers, and even customers are also invited. Teams think differently about design tradeoffs when they hear a customer’s frustration on the map straight from their mouths. An engineer hearing a customer say “I spend 30 minutes a day dealing with this workaround” prioritizes differently than when the engineer reads “Optimize the X workflow”.
Top companies employ several discovery methods to triangulate:
Product Analytics Review: For current products, looking at what users actually do (which features they use, where they drop off, which workflows they abandon) is more honest than surveys.
Competitive Analysis: Researching how your competitors address the same issue (and which features they highlight vs. downplay) can provide insight into what matters to their users.
The Five Whys Technique: When a customer mentions an issue, asking “Why?” five times will help in uncovering the root cause:
Surveys: Large-scale estimation in quantitative terms following interviews. Surveys tell us whether the issues found with 20 people are common issues across the market. Don’t begin with surveys—validate with surveys.
Why This Stage is Important:
If the team is not aligned on the problem, then solutions will diverge. The best product companies lead with shared understanding, not shared work.
Personas reflect who you are building for—not as marketing caricatures, but as guides to solving problems:
Important Persona Details:
Journey maps illustrate the full end-to-end experience—from realizing there’s a problem, to looking for solutions, through utilizing the product:
text
Problem Awareness
↓ (Customer realizes problem is bigger than workaround)
Research Phase
↓ (Google, asks colleagues)
Evaluation Phase
↓ (Tries 2-3 solutions)
Purchase Decision
↓
Onboarding Experience
↓
Feature Adoption
↓
Long-term Retention
Mapping out the journey identifies areas where product teams can have a potential impact on decisions and where they can’t.
Leading companies express the value of their proposition clearly:
For [Target Customer] who wants to [solve X problem],
[Product Name] is a [category]
that [solves the problem differently than competitors].
Unlike [alternatives], we [unique benefit].
For instance:
For Customer Success teams who need to minimize the time they spend on ticket triage,
TicketGenius is an AI ticket routing tool
that prioritizes and categorizes tickets automatically.
Unlike rule-based engines, we learn from your team’s decisions and evolve.
This transparency prevents teams from developing features that nobody requested.
Why This Stage Is Important:
MVPs are unsuccessful not because of a lack of features, but because of an excess. Scope creep is the #1 reason MVPs run 2-3x longer than estimated.
Best companies apply the MoSCoW framework to make tough decisions:
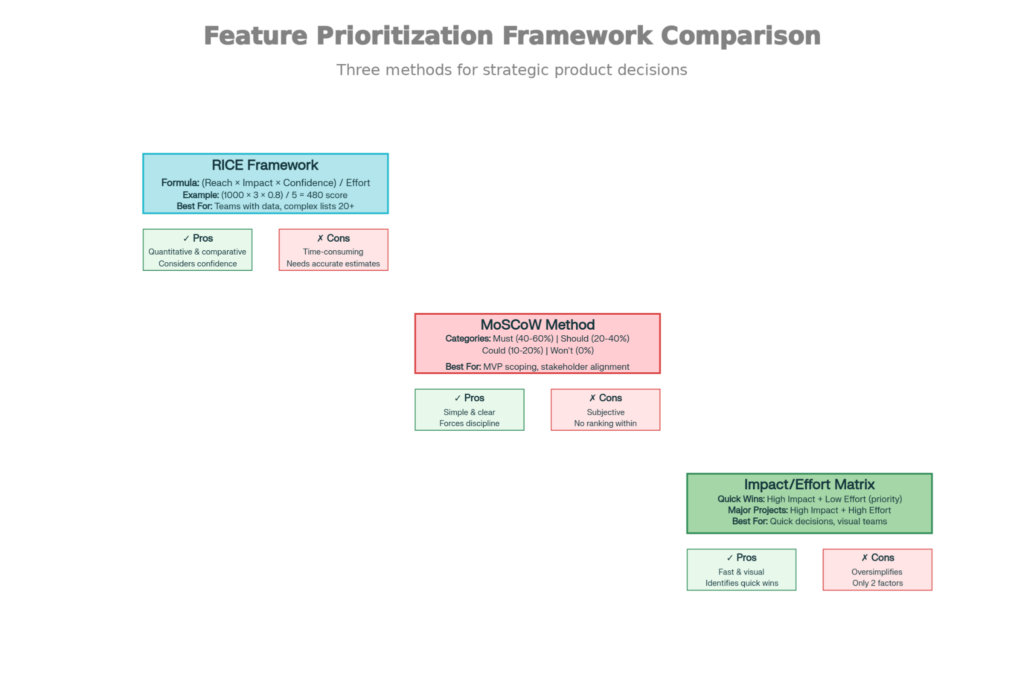
Frameworks for Prioritizing Features: RICE, MoSCoW, and Impact/Effort Comparison
Must-Haves (40-60% of features): Essential features demonstrating value proposition. For a ticketing system: AI categorization, assignment, and notification. Without these, the core problem wasn’t being addressed by the product.
Should-Haves (20-40% of features): Nature of the feature would greatly enhance the end product, but is not considered essential for MVP. Advanced analytics, Slack integration, custom workflows. V1.1 additions.
Could-Haves (10-20% of features): Features that are nice to have but not critical/essential. Mobile app, dark mode, managers notified to escalate automatically. V2/V3 additions.
Won’t-Haves (Out of Scope or Too Hard for Now): Features that sound nice, but will not be included in MVP scope. Enterprise SSO, audit logging, and multi-tenancy. Documented, so stakeholders know these were explicitly considered.
Why This Works: The discipline of saying “No” to what you cannot and must focus on teams. Our thinking was, if a team comes up with 30 features, and 25 features are for “good to haves”, and 5-7 features are must-haves, the question becomes clear: “What is the minimum we need to prove the core assumption?”
When the features of the must-have category could be prioritized in different ways, RICE gives a numerical ranking:
RICE Score = (Reach × Impact × Confidence) / Effort
Reach: How many users are impacted? (Users affected per month)
Impact: How important is it? (3=massive impact, 2=high, 1=medium)
Confidence: How confident are we? (0-100% chance it works)
Effort: What is the duration of engineering time? (Person-weeks)
Example: Ticket Routing MVP with 4 essentials
Feature A (Categorization): (1000 × 3 × 0.9) / 4 = 675
Feature B (Assignment): (1000 × 3 × 0.8) / 3 = 800
Feature C (Notifications): (500 × 2 × 0.7) / 2 = 350
Feature D (Reporting): (200 × 2 × 0.6) / 5 = 48
Ranking: B (800), A (675), C (350), D (48)
Develop in this order to get the most value per engineering week.
Roadmap from MVP to Full Product: Strategic Phasing from Validation to Scale
MVP is about 30-40% of the entire end vision for top companies:
Scope of MVP: 3-5 Must-Have Features → 4-8 weeks development
Instead of:
“Let’s build the whole vision” → 6-12 months development → Fails to launch
Why This Stage Matters:
Assumptions about what users want and how they will behave are wrong, even after careful discovery. Real users reveal these quickly.
Leading businesses release MVPs to 50–500 beta users before going public:
Week 1-2: 50 internal/friendly users (team members, trusted advisors). Find obvious bugs, UI issues, and core flow issues.
Week 2-4: 200-500 early adopters (drawn from waitlist, beta communities, target user groups). Actual usage surfaces edge cases, preferences around features, and retention patterns.
Success Requirements:
If any of these checks fail, the MVP is not mature enough to be rolled out. Issues are resolved based on feedback before scaling.
Top companies gather feedback in beta through several channels:
In-App Surveys: “What is the most valuable feature so far?” “What frustrated you?” Short, contextual queries result in high response rates.
User Interviews: Deeper interviews are conducted with 10-15 beta users. “Walk me through how you used the product. Where did you get stuck?” These conversations provide insight into why the metrics are the way they are.
Analytics Dashboards: Funnel analysis allows you to see where users leave. Feature heat maps indicate which features are used in practice. Session recordings play a part in revealing confusion points.
Tickets Support: A support question is the tip of the iceberg about something — a baffling UX, an absent feature, a real-world set of expectations with which your product no longer aligns.
This information goes straight into Stage 5.
Why This Stage is Important:
The quality of iteration is what separates successful products from those that fail. Post-launch improved products hold on to users 3-5x better than products that never move.

Roadmap for MVP to Complete Product: Strategic Phasing from Validation to Scale
MVP (wks 1-8): Solves the core problem with the minimum features. Objective: Confirm the major assumption.
MVP v1.1 (wks 9-12): MVP + improvements based on beta feedback + 2-3 new features. Objective: Increase retention.
The differentiation does matter. MVP “demonstrates the concept” actually works. V1.1 demonstrates that it can keep users. V2 demonstrates that it can get large.
Instead of guessing at which factors among a sprawling universe of them matter the most, leading companies rely on data:
Examine Beta Information:
User Interviews for Churned Users:
Top companies will interview 5-10 churned users who took the product for a spin and then decided to stop. “Why did you stop using our product?” These conversations will often reveal that your perceived core value wasn’t really what users valued in the product.
Determine Enhancements:
Sample MVP→V1.1 Iteration:
MVP contained: Simple categorization, manual assignment, and email alerts.
Beta data showed:
V1.1 enhancements:
Outcome: 7-day retention improved 40% → 60%. Churn down. V1.1 is launched and validated.
Why This Stage Is Important:
When it comes to product decisions, there’s a range of opinions. Data does not. The best companies run 10-20 A/B tests per month and aggregate gains into 30%+ improvements annually.
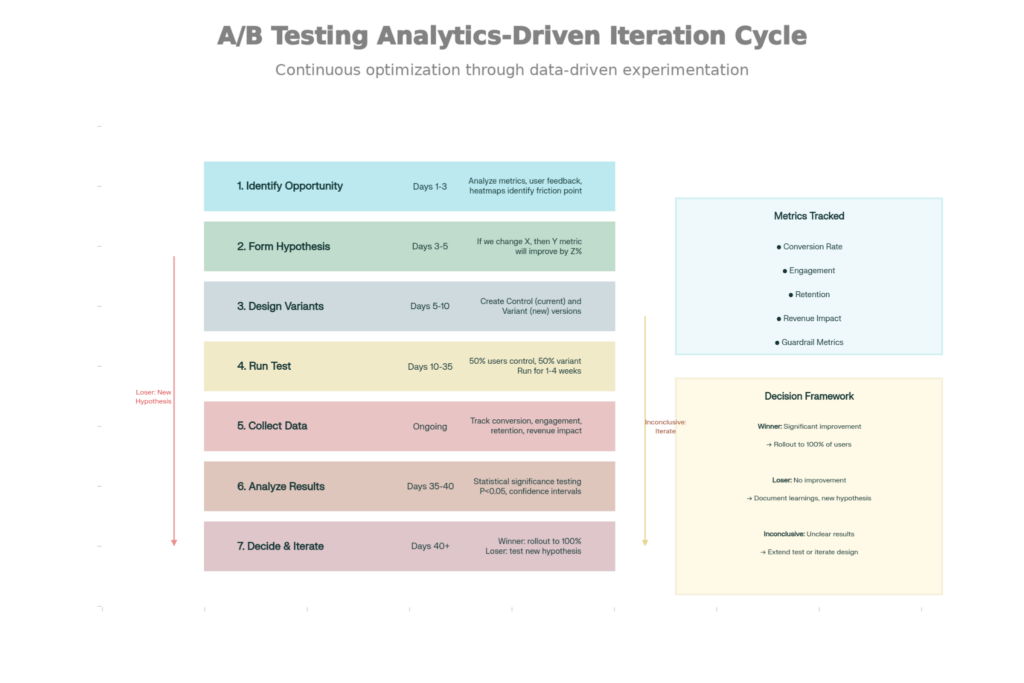
Analytics-Driven Iteration & A/B Testing: Ongoing Cycle of Product Optimization
Step 1: Spot the Opportunity (Search for friction in the data)
Instead of “let’s make signing up better,” leading firms examine granular data:
These particular observations dictate testing priorities.
Step 2: Develop a Specific Hypothesis (Data-based, testable)
❌ Vague: “Improving onboarding will increase retention.”
✅ Specific: “If we add a 3-question onboarding walkthrough (vs. skippable), the 7-day retention rate will improve 5% (from 60% to 63%).”
The level of specificity matters—it informs what to be measured and how long to run the experiment.
Step 3: Variants in Design
Control (Existing experience, what 50% of your users see)
Variant (Proposed change, what 50% of your users see)
Randomization makes the two groups comparable, in the statistical sense; any difference observed in the metrics is attributed to the change rather than to different users.
Step 4: Execute Test (To determine statistical significance)
The test runs until you have sufficient data to be certain. That typically means:
Step 5: Analyze the Results (Statistically rigorous testing of hypotheses)
Raw data: Test group retention was 63%; Control was 61%.
Statistical test (Chi-squared): P-value = 0.02 (significant at 95% level of confidence)
Conclusion: The 2 percentage point increase is real and not a chance occurrence.
Step 6: Decide & Implement (Roll out winners, losers feed into next test)
If Winner: Roll out to 100% of users. Monitor after implementation to ensure the results hold.
If Loser: Write up why the hypothesis failed. This informs the next test. “We assumed that including onboarding would enhance retention, but it actually confused users who were not familiar with the product type. Next: test minimal onboarding instead.”
If Inconclusive: Prolong the experiment (need more data) or increase the effect size of the variant (try a more extreme change).
As teams run 10 to 20 tests per month, it becomes:
A 26% uplift for key metrics (retention, revenue, engagement) is game-changing.
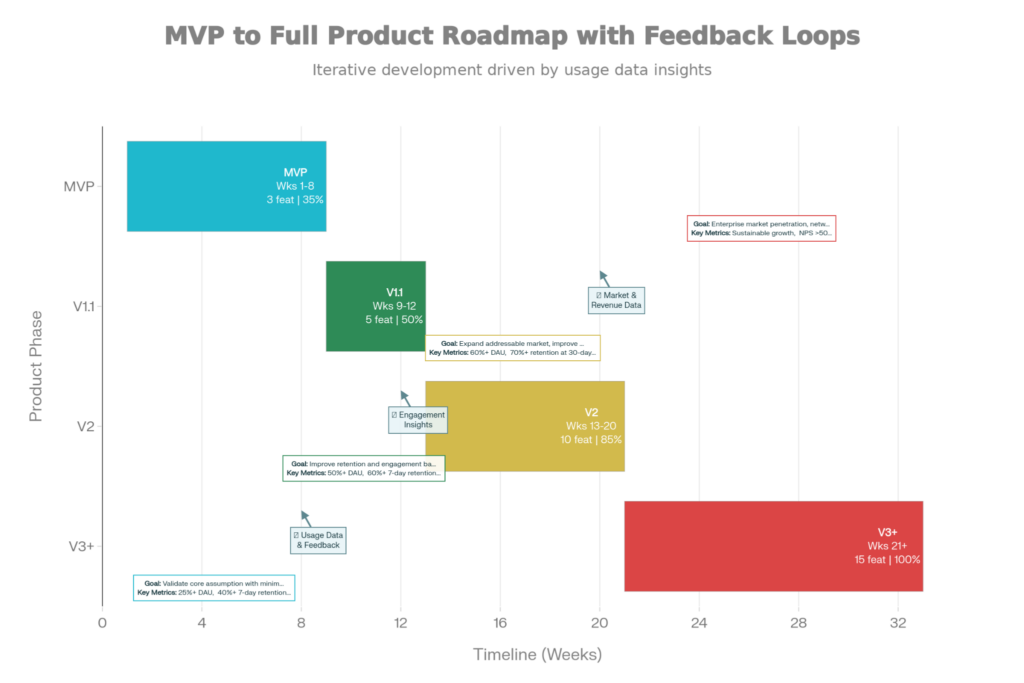
Leading product engineering firms design roadmaps based on iterative validation rather than feature checklists:
MVP (W1-8): 3-5 must have characteristics, validates core assumption, goal: 25%+ DAU, 40%+ retention
V1.1 (W9-12): MVP + tweaks + 2-3 more features, makes users stick around more, goal: 50%+ DAU, 60%+ retention
V2 (W13-20): More advanced features, integrations, admin tools, opens up market, target: 70%+ retention, enterprise interest
V3+ (Weeks 21+): Enterprise functionality, APIs, ecosystem, and growing sustainably.
At each point, hypotheses are tested before moving on to the next stage. A roadmap isn’t a promise of what features you will build; it’s a plan to learn.
The distinction between a coder factory and a product engineering partner is this: One just builds what you ask for. The other helps you figure out what you really need.
Top product engineering companies, such as Ateam Soft Solutions (awarded for product engineering expertise), have a different way of approaching projects:
Before Starting Code:
When Building:
Post-Launch:
This process is slower at the start (4-6 weeks of discovery), but it stops years of development wasted on unverified assumptions.
The math is straightforward: 4 weeks of discovery for avoiding 12 weeks of wasted development = a net 8 weeks saved, plus better product-market fit.
In 2025, code quality is a given. There are thousands of companies that can build technically excellent software. What makes the difference between a successful and failed product is product thinking—the art of understanding users, testing assumptions, and iterating in real usage conditions before and after launch.
When you’re evaluating development partners, ask:
The solutions distinguish true product engineering partners from coder factories.
What you build matters less to your product’s success than whether you built the right thing. Partner up accordingly.