Security incidents in 2025 will cost the average organization $4.45M per incident, with 287 days to detect and 80 days to contain. Web app security is non-negotiable for CTOs and technology leaders: they must be intimately familiar with the OWASP Top 10 weaknesses, employ defense-in-depth, and keep pace with security maturity—or risk obsolescence.
This all-encompassing guide offers OWASP-compliant checklists, implementation models, cost analysis, and practical remediation techniques based on the 2021 OWASP Top 10 (current until 2025) and the best in the industry.
OWASP Top 10: The Cornerstone of Web Application Security
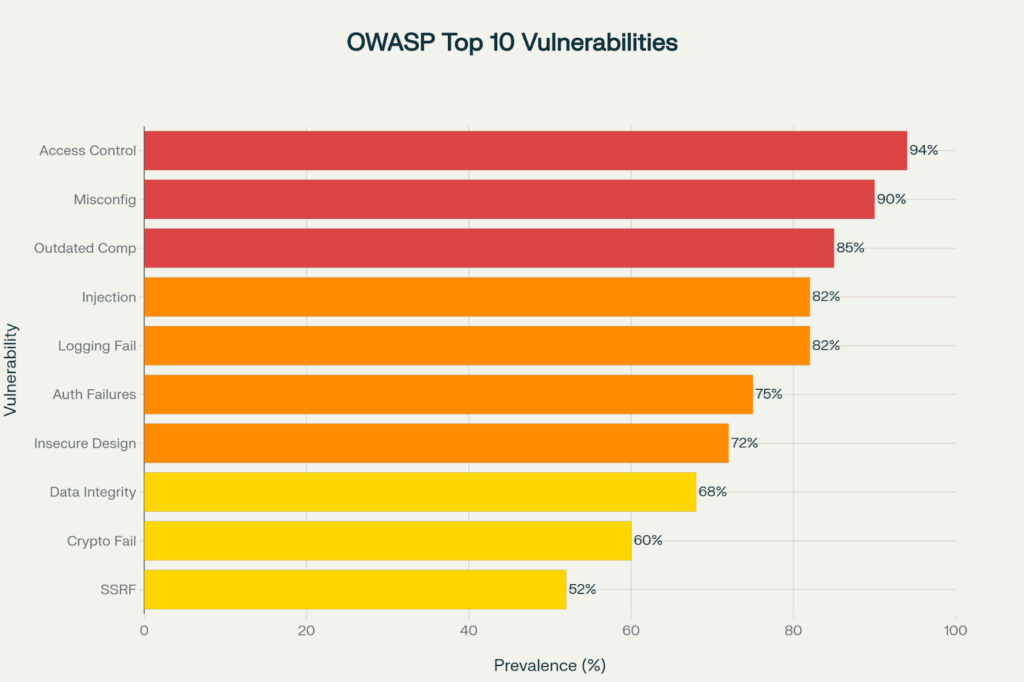
Prevalence of OWASP Top 10 Vulnerabilities in Web Applications (2021-2025)
The Open Web Application Security Project (OWASP) Top 10 is the result of a broad consensus among security experts all over the world, representing the most critical risks to web applications. The 2021 list, updated every four years with data from thousands of applications (current through 2025), represents current threat landscapes.
1. Broken Access Control (94% prevalence) – Top Risk
Broken Access Control climbed to first place in 2021, impacting 94% of all tested applications—the most widespread vulnerability.
What it is: Enforce User Access Permissions Miss Honoring User Restrictions (resulting in unauthorized access to functionality or data).
Common examples:
Insecure Direct Object References (IDOR): Changing URL parameters to access other users’ data (/api/user/123 → /api/user/124)
Metadata manipulation: Modifying JWT tokens or cookies to elevate privileges
CORS misconfiguration: Allowing unauthorized cross-origin requests
Impact in the real world: Experian (2013), 200 million personal records exposed due to IDOR vulnerability. The Capital One breach (2019) exposed 100 million customer records as a result of misconfigured firewalls and broken access controls.
Prevention strategies:
Deny by default: Require explicit permissions for every resource
Implement robust RBAC (Role-Based Access Control): Define roles with least privilege
Validate authorization server-side: Never trust client-side checks
Log access control failures: Track unauthorized access attempts
Use automated testing: Tools like Burp Suite detect IDOR vulnerabilities
Cost of implementation: $2,000 for setup, $200 for yearly maintenance, and 10 days for implementation.
2. Cryptographic Errors (60%): The Second Risk
Formerly “Sensitive Data Exposure,” this issue is concerned with matters that could result in insufficient protection of data while at rest or in transit through the use of cryptography.
What it is: Too little encryption, poor algorithms, or no encryption at all that leads to data being stolen or tampered with.
Common examples:
Storing passwords in plain text or using weak hashing (MD5, SHA1)
Transmitting sensitive data over HTTP instead of HTTPS
Using outdated SSL/TLS versions (SSL 2.0, SSL 3.0, TLS 1.0)
Weak encryption algorithms: DES, 3DES, RC4
Hardcoded encryption keys in source code
Effects in the real world: The Adobe breach (2013) released 150 million user credentials that were stored with weak encryption. The Equifax breach (2017) exposed 147 million records in part due to encryption failures.
Prevention strategies:
Encrypt data at rest: Use AES-256 for stored sensitive data
Encrypt data in transit: Enforce TLS 1.3 with HSTS headers
Use strong password hashing: bcrypt, Argon2, PBKDF2 (NOT MD5/SHA1)
Cost of implementation: SSL/TLS: $100 setup and $100 per year. Encryption at rest: $3,000 for setup and $500 per year, 20 days.
3. Injection (82% Prevalence) – #3 Risk
Injection effects 82% of applications and SQL injection is still the most prevalent one.
What it is: Attacker-controlled data is processed by an interpreter (SQL/NoSQL, OS command, LDAP, etc.) as a command or query, which results in the execution of a second command or query.
Common examples:
SQL Injection: SELECT * FROM users WHERE username=’admin’–‘ AND password=”
NoSQL Injection: Manipulating MongoDB queries via JSON payloads
OS Command Injection: Executing shell commands through vulnerable inputs
LDAP Injection: Bypassing authentication through directory queries
XPath/XML Injection: Extracting XML data through malformed queries
Consequences: Sony Pictures breach in 2011, where SQL injection was leveraged to steal 1 million user accounts. TalkTalk breach (2015)—£77m lost due to an SQL injection attack.
Prevention strategies:
Use parameterized queries (prepared statements): Separates code from data
Cost of implementation: Input validation framework: $5,000 implementation, $1,000 per year maintenance, 30 days. WAF: $2,000 implementation, $6,000 per year maintenance, 10 days.
Code example (vulnerable vs secure):
python
# VULNERABLE
query = f”SELECT * FROM users WHERE email='{user_input}'”
Insecure Design is a new category for the 2021 Top 10 and relates to weaknesses in design rather than implementation bugs.
What it is: Security control that is absent, misconfigured, or broken by an application’s design that cannot be remediated via better code.
Common examples:
Missing rate limiting: Allowing unlimited password attempts or API calls
Insufficient business logic validation: Bypassing payment or approval workflows
Lack of segregation of duties: Single user performing conflicting actions
Missing threat modeling: Not identifying attack vectors during design
Insufficient logging: No audit trail for critical business functions
Impact in the wild: GitHub OAuth bug (2020) let attackers persist after a user revoked access because of a design flaw.
Prevention strategies:
Conduct threat modeling: STRIDE, PASTA, or Attack Trees during design
Implement security by design: Security requirements in every user story
Use secure design patterns: Defense in depth, fail securely, least privilege
Document security architecture: Attack surface analysis, data flow diagrams
Perform design reviews: Security architect involvement before coding
Cost of implementation: Threat modeling: $5,000, 10 days Security requirements definition: $3,000, 5 days.
5. #5 Risk: 90% Prevalence of Security Misconfiguration
Security misconfiguration: 90% of applications, is widespread and an easy target for attackers.
What it is: Misconfigured security settings, incomplete configurations, exposed cloud storage, detailed error messages, or turned-off security controls.
Common examples:
Default credentials admin/admin and root/root left unchanged
Directory listing enabled: Exposing file structure and sensitive files
Detailed error messages: Stack traces revealing system architecture
Unnecessary features enabled: Sample applications, admin consoles
Unpatched systems: Missing security updates and patches
Actual impact: The Capital One breach (2019) took advantage of AWS S3 misconfiguration, leaking 100 million records. The Uber breach (2016) leveraged exposed AWS keys in GitHub to exfiltrate 57 million user records.
Prevention strategies:
Harden default configurations: Remove or disable default accounts
6. #6 Risk: Vulnerable and Outdated Components (85% Prevalence)
85% of applications are built using components with known vulnerabilities, which makes this risk one of the simplest to exploit and also to prevent.
When it happens: Using libraries, frameworks, or other components that have known security vulnerabilities.
Common examples:
Outdated JavaScript libraries: jQuery, Angular, React with known CVEs
Vulnerable server software: Apache Struts, WordPress plugins
Deprecated APIs: Using unsupported library versions
Transitive dependencies: Vulnerabilities deep in dependency trees
Lack of dependency tracking: Not monitoring component versions
Impact on real life: Equifax breach (2017) used the Apache Struts vulnerability (CVE-2017-5638) and impacted 147 million people. Log4Shell (2021) impacted millions of applications worldwide in the Log4j vulnerability.
Prevention strategies:
Maintain software bill of materials (SBOM): Track all dependencies
Metasploit: Open source, free, 95% detection rate, very low false positives
Best for: Validating vulnerabilities, testing business logic, compliance requirements
Costs of Implementing Security
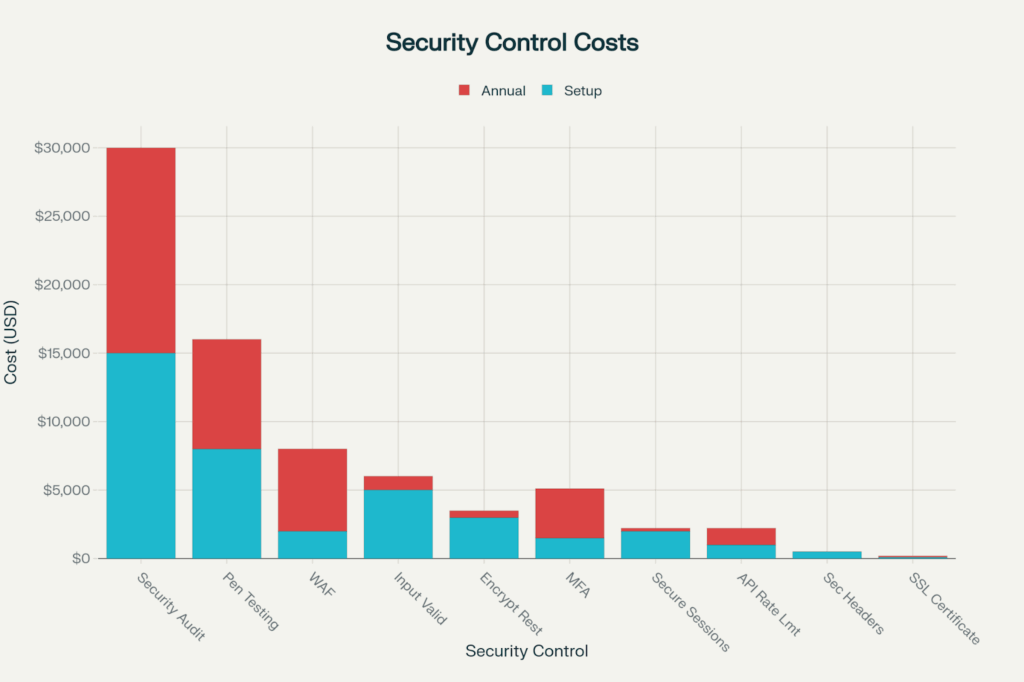
Security Control Implementation Costs: One-Time vs Ongoing (USD 2025)
Security spending varies from $100 SSL certificates to $30K annual audits, but stopping a $4.45M breach yields a 148:1 ROI.
Quick wins (under $1,000 setup):
SSL/TLS certificates: $100 setup, $100 annual
Security headers: $500 setup, $0 annual, 3 days implementation
API rate limiting: $1,000 setup, $1,200 annual, 7 days
Core security ($1,000-$5,000 setup):
Multi-factor authentication: $1,500 setup, $3,600 annual, 15 days
WAF deployment: $2,000 setup, $6,000 annual, 10 days
Secure session management: $2,000 setup, $200 annual, 10 days
Encryption at rest: $3,000 setup, $500 annual, 20 days
Advanced controls ($5,000-$15,000 setup):
Input validation framework: $5,000 setup, $1,000 annual, 30 days
Penetration testing: $8,000 annually, 5 days
Security audit (comprehensive): $15,000 annually, 10 days
Complete first-year security budget for a medium-sized web application: $30,000-$80,000 (initial setup + yearly costs), which is a fraction of the costs of a typical breach.
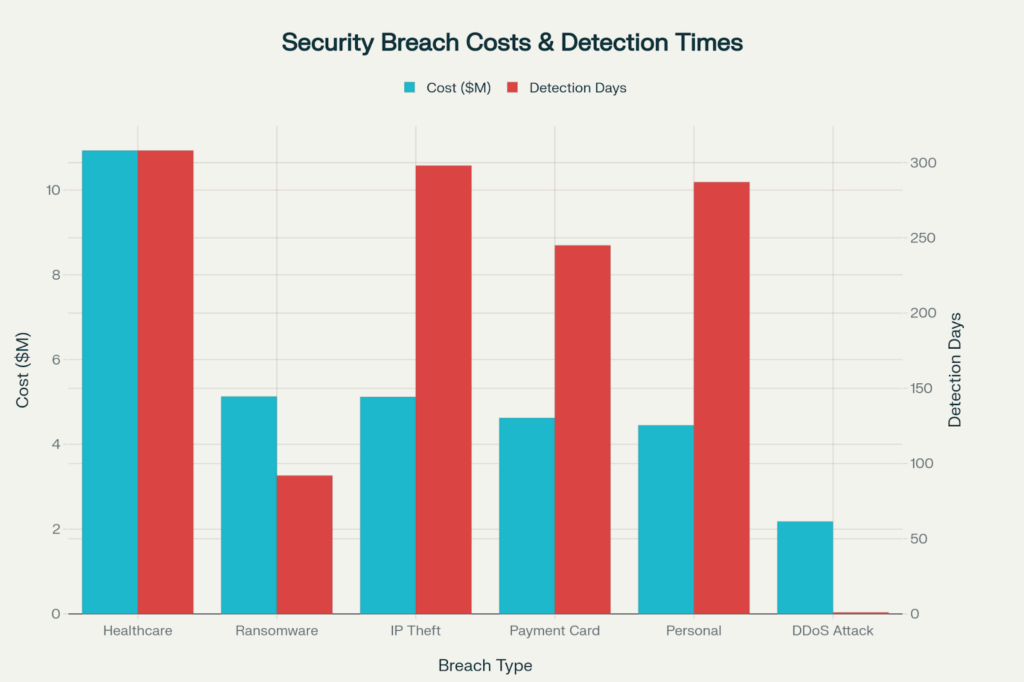
Effect of the Security Breach
The price of insecurity is a lot higher than the price of security.
Healthcare records breaches cost on average $10.93 million with 308 days to detect and 89 days to contain—the longest across all breach types.
The average payment card data breach costs $4.62 million, and breaches remain undetected for an average of 245 days, which would compound PCI DSS compliance fines with forensic investigations.
Ransomware attacks are the most expensive in average costs ($5.1 million) but are detected much sooner (92 days) because they are disruptive (impact on reputation: 8/10).
A personal data breach costs $4.45 million, and they are detected after 287 days on average—the industry baseline for comparison.
Customer churn: 65% of breach victims consider switching providers
Model of Security Maturity
Organizations progress through five security maturity levels, each decreasing the probability of being breached and the time to being detected:
Level 1: Ad-Hoc (1% security budget):
No formal security program
Reactive fixes only after incidents
Very high breach likelihood
365 days average detection time
No compliance readiness
Level 2: Reactive (3% security budget):
Basic security controls implemented
Reactive approach to vulnerabilities
High breach likelihood
287 days detection time (industry average)
Basic compliance capabilities
Level 3: Defined (5% security budget):
Documented security processes
Regular security testing
Medium breach likelihood
180 days detection time
Good compliance readiness
Level 4: Managed (8% security budget):
Continuous monitoring and automated testing
Proactive vulnerability management
Low breach likelihood
90 days detection time
Excellent compliance posture
Level 5: Optimized (12% security budget):
Security-first culture throughout organization
Proactive threat hunting
Very low breach likelihood
30 days detection time
Continuous compliance excellence
Advancing from Level 1 to Level 5 decreases the probability of a breach and its detection time by 90% and 92%, respectively, and raises the security budget from 1% to 12%—still a tiny fraction of breach costs.
CTOs’ Actionable Security Checklist
Phase 1: Immediate Actions (Week 1-2):
✅ Enable HTTPS with HSTS headers across all properties
✅ Disable directory listing and error detail exposure
Phase 2: Quick Wins (Month 1):
✅ Deploy Web Application Firewall (WAF)
✅ Implement rate limiting on authentication and APIs
✅ Add centralized logging for security events
✅ Conduct dependency scan and patch critical CVEs
✅ Implement parameterized queries across codebase
Phase 3: Foundational Security (Quarter 1):
✅ Conduct threat modeling for all applications
✅ Deploy SAST and DAST in CI/CD pipeline
✅ Implement input validation framework
✅ Establish secure session management
✅ Create incident response plan
Phase 4: Advanced Maturity (Year 1):
✅ Achieve Level 3 security maturity
✅ Conduct annual penetration testing
✅ Implement comprehensive security audit
✅ Establish security training program
✅ Automate security testing in DevSecOps pipeline
The 2025 Reality: Everyone Is Accountable for Security
Access control is broken in 94% of web applications. 90% are affected by security misconfiguration. 85% contain vulnerable components. These are not corner cases, but the average.
For CTOs in 2025, OWASP Top 10 is not advice—it’s background noise. Security testing tools: $0-$200K/year. Security controls: $30k-$80k first year. The average breach costs $4.45 million.
The math is straightforward: You can either pay to protect yourself now or pay to clean up the mess later at 50 to 150 times the cost of protection.
Useful guide, correct checklist implementation, and use of recommended controls = design web apps that protect user data and the business and are attack resistant. Because in 2025, security isn’t a feature—it’s a requirement.