In 2025, Australian companies that want to invest in web development will have a basic choice: hire local Australian agencies at AUD 90-250/hour or work with Indian firms at USD 15-90/hour (68% cost savings). Beyond budgets, the decision affects the timeline of the project, quality of results, and long-term evolution.
This in-depth report includes analytical comparisons, a weighted decision matrix, capabilities-based quality benchmarks, and collaboration models that assist CTOs and founders in making the best vendor selection decisions for their web projects in 2025.
The web development market in Australia charges high rates due to the expensive labor, strong regulations, and mature technology industry.
Sydney ranks between AUD 100 and 250/hour (approximately AUD 160), Melbourne comes at AUD 90-220/hour (approximately AUD 145), and Brisbane is the cheapest at AUD 80-200/hour (approximately AUD 135).
Project-based pricing:
Top Australian companies offering similar services are DianApps (Sydney), Stone Digital (Sydney), Chromatix (Melbourne), EB Pearls (Surry Hills), DigiGround (Sydney), and SolvitX (Brisbane)—all boasting 4.6-4.8 ratings on Clutch and team sizes of 50-250.
With a USD 47.6 billion software engineering market size predicted by 2030, India offers excellent technical expertise at a fraction of the cost in Australia, ranging from 50% to 68%.
Bangalore comes at an average of 25-90 USD/hour (50 USD is the average), Hyderabad 20-75 USD/hour (42 is the average), Pune 22-80 USD/hour (45 is the average), and Tier 2 cities 12-50 USD/hour (28 is the average).
Project-based pricing:
Top Indian Firms: The NineHertz (Jaipur), Appinventiv (Noida), Hyperlink InfoSystem (Ahmedabad), ValueCoders (Mohali), MindInventory (Ahmedabad), and OpenXcell (Ahmedabad)—all boasting 4.7-4.8 Clutch ratings and team sizes ranging from 250 to 1,500.
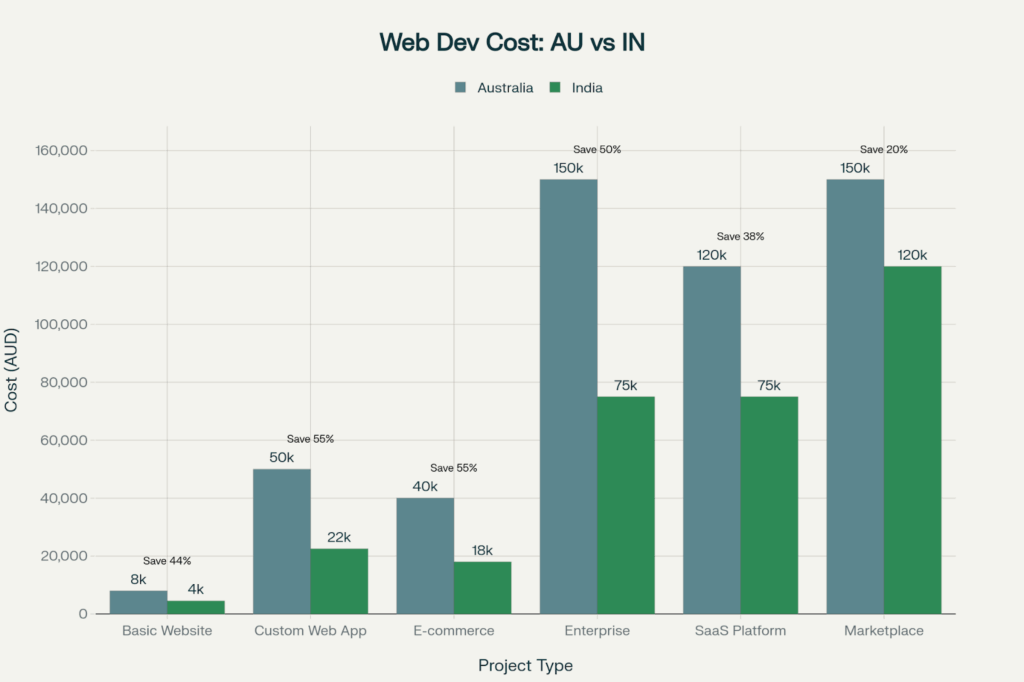
Comparison of Web Development Prices: Australia vs India (2025, AUD)
Converting to AUD (1 USD = 1.5 AUD is the estimate here):
Basic Business Site: AU$3,000-8,000 vs. India AU$1,500-4,500 = 44-56% savings
Custom Web Apps: Australia AUD 15,000-50,000 vs India AUD 7,500-22,500 = 50-55% in savings
E-Commerce Systems: Australia AUD 10,000-40,000 vs India AUD 4,500-18,000 = 55-68% in savings
Enterprise solutions: In Australia, they are between AUD 50,000 and 150,000, and in India they are at AUD 22,500-75,000, the savings being 50-67%
SaaS platforms: Australian dollar 60,000-120,000 vs Indian rupee 30,000-75,000 = 38-50% savings
Marketplace websites: Australian dollar 70,000-150,000 vs Indian rupee 37,500-120,000 = 20-47% savings
The savings are significant for all types of projects, but the percentage saved is higher for simpler projects, and the absolute dollar saved is higher for enterprise/SaaS builds.
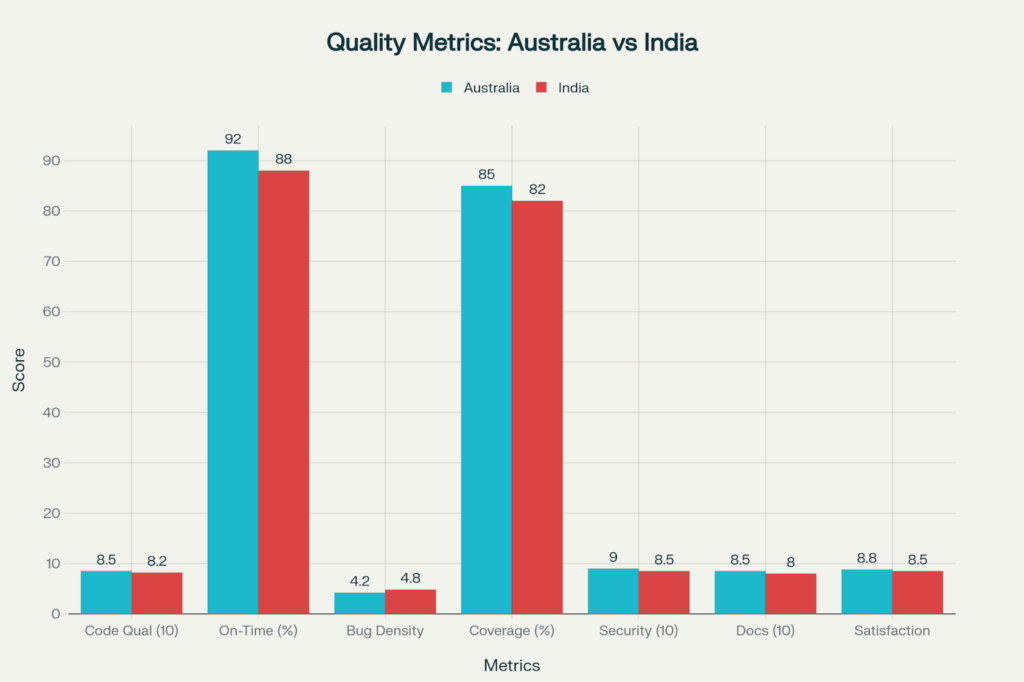
Comparison of Quality Metrics: Leading Agencies in Australia and India (2025)
Top Australian agencies achieve:
Top Indian agencies deliver:
Top Australian and Indian agencies have marginal differences (3-5% across most metrics), indicating quality is a function of vendor selection rigor and not geography.
But average Indian firms lag far behind: 7.0/10 for code quality, 78% for on-time delivery, and 8.0 for bug density—a reminder of why vendor vetting is so important if you want to succeed offshore.
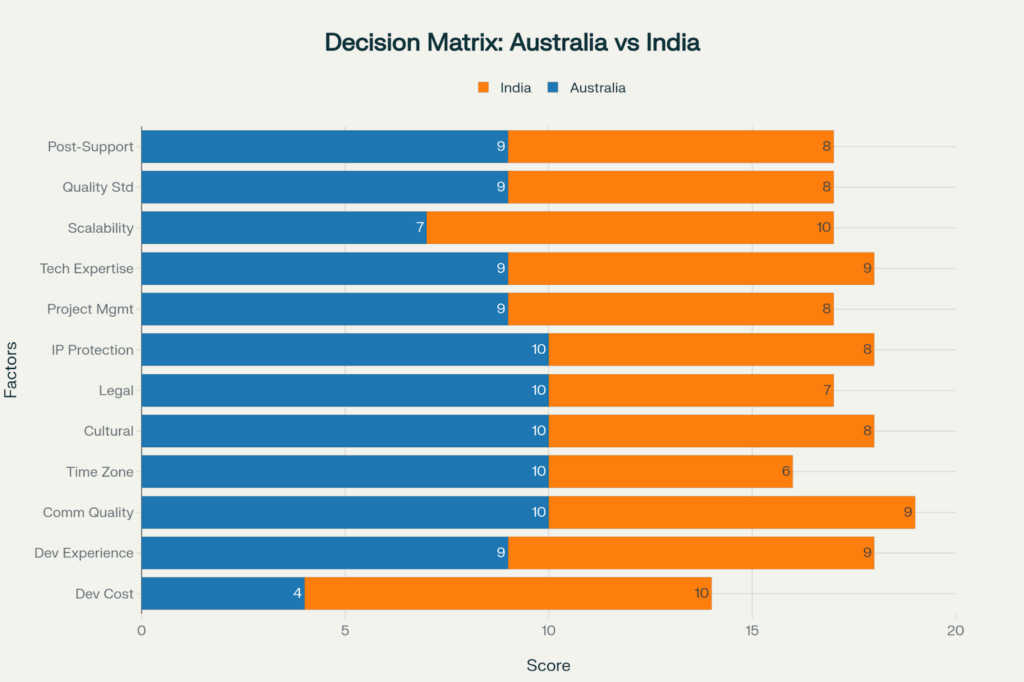
Decision Matrix: Australia vs India Web Development (Scores are out of 10 for 2025)
We analyzed 12 essential criteria that were weighted accordingly to establish an objective comparison matrix:
Development Cost (20% weight): India 10/10, Australia 4/10. The single biggest factor is India delivers 50-68% savings.
Developer Experience (10% weight): Both 9/10. The top agencies in each country have 10 to 15 years of average experience, extremely deep technical stacks, and proven portfolios.
Quality of Communication (10% weight): Australia 10/10, India 9/10. Australia provides the benefit of native English speakers and cultural understanding, whereas India has an excellent 9/10 English (top agencies) that sometimes needs clarification.
Time Zone (8% Weightage) … Australia 10/10, India 6/10. With a difference of only 4.5 hours and an overlap of 3.5 hours (2:30-6 PM AEDT = 10 AM-1:30 PM IST), Sydney-India daily standups are feasible but not recommended for active collaboration.
Cultural Alignment (7% weight): Australia 10/10, India 8/10. Australian teams have an understanding of local business practices, consumers, and regulatory requirements, while Indian teams need cultural onboarding and context-setting.
Legal System (8% weight): Australia 10/10, India 7/10. Australian contracts are governed by well-known Australian law with a straightforward path to recourse; Indian contracts are riddled with cross-border legal complexity and navigation through the GDPA/Privacy Acts.
IP Protection (7% Weightage): Australia 10/10, India 8/10. While Australia does provide strong IP protection under Australian law, India requires strong NDAs, contracts that specifically include an assignation of IP rights, and a leap of faith in vendor integrity.
Project Management (8% weight): Australia 9/10, India 8/10. Australian companies have great transparency when it comes to processes and predictable procedures and tell you ASAP if you need to do something. Indian teams are great, but a touch more hands-on is sometimes needed.
Technical Expertise (10% weight): Both 9/10. Each nation has great developers specializing in React, Node.js, Python, AWS, and AI/ML. India is actually ahead in emerging tech adoption with 75% AI integration by 2025.
Scalability (5% weight): Australia 7/10, India 10/10. Australia has limited talent to scale rapidly, while India boasts 1.5 million engineering graduates annually from which to scale from 5 to 50 developers within weeks.
Quality Standards (5% weight): Australia 9/10, India 8/10. Premium Australian brands retain a slightly higher average quality bar, although premium Indian agencies (ISO 27001 and ISO 9001 certified) are on par with this.”
Post-Launch Support (2% weight): Australia 9/10, India 8/10. Australian teams are quicker to respond in Australian business hours, and Indian teams have strong SLAs, but support is time-zone shifted.
Total weighted scores: Australia 8.1/10 (81%), India 8.3/10 (83%)—indicating that India is the better value for money overall when cost is given suitable importance, but non-cost factors favor Australia.
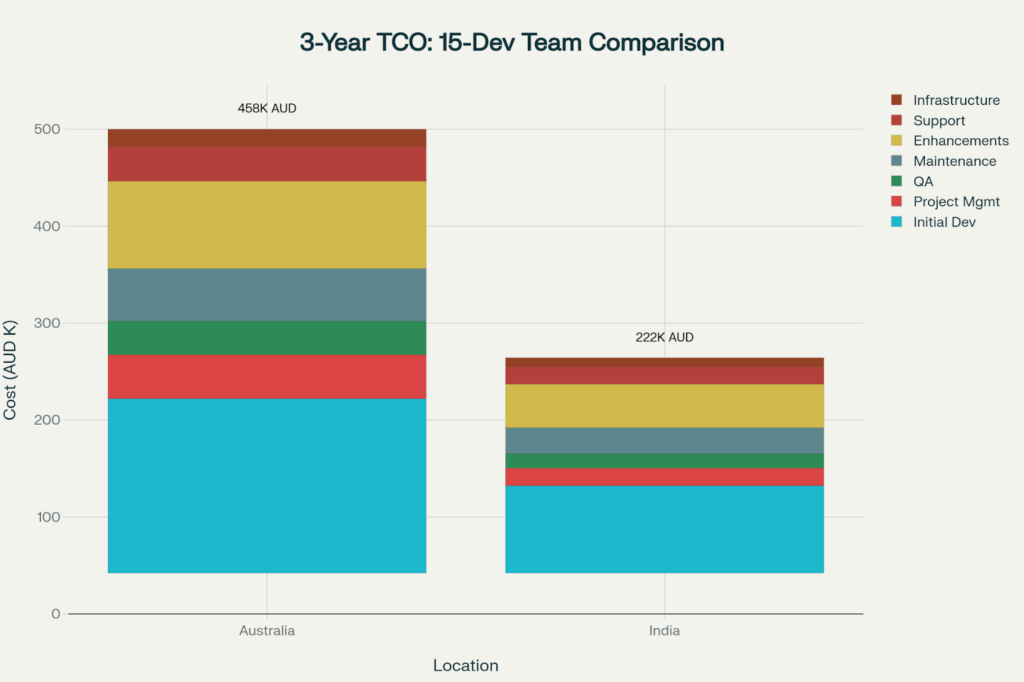
3-Year Total Cost of Ownership: Comparison between Australia and India (15-Dev Team, AUD thousands)
For a team of 15 developers over 3 years:
Australia Total Cost: AUD 458,000
India Total Cost: AUD 222,000 (USD 148K × 1.5)
3-Year Savings with India: AUD 236,000 (51%)—which could be used to develop an additional product, hire engineers internally, or for growth marketing.
Perth has the best overlap with India: 5.5 hours per day (12:30-6 PM AWST = 10 AM-3:30 PM IST) with 92% of the communication ability.
Brisbane has a 4-hour overlap (2:30-6:30 PM AEST = 10 AM-2:30 PM IST), which offers 87% efficacy.
Sydney/Melbourne have a 3.5-hour overlap (2:30-6 PM AEDT = 10 AM-1:30 PM IST), which corresponds to 85% efficiency—enough for daily standups, sprint planning, and go/no-go decisions.
Brisbane’s 4-hour window is duplicated by Adelaide—also achieving 87% efficiency.
There are many best practices for AUS-India collaboration:
Have core meetings during the overlap time: Daily standup at 3-4 PM AEDT gives both teams a midday presence.
Use async-first tools: Loom for video walkthroughs, Notion for documentation, and Slack threads for detailed discussions to facilitate 24-hour dev cycles.
Set clear communication protocols: Response time SLAs (urgent <4 hours, normal <24 hours), escalation paths, and decision-making authority.
Weekly video calls, daily async updates: Mix live connection with recorded progress.
Compliance with regulations is essential: Finance, healthcare, government projects performing data residency in Australia, privacy compliance, and local law oversight.
Real-time collaboration is a given: Projects that benefit from instantaneous feedback loops, quick pivots, and ongoing stakeholder involvement.
Australian market knowledge required: Consumer-facing applications where knowledge of local UX preferences, payment options (AfterPay, ZIP), and cultural composition is a key to success.
Internal team augmentation: Expanding existing Australian teams through a large pool of contractors able to work natively with local workflows and offices.
The budget allows for quality-of-life premiums: Deep-pocketed organizations that are happy to pay 2-3x more for perceived risk reduction and ease of use.
Cost efficiency is a priority: SMEs, scale-ups, and startups with 50-68% savings that can be used for extending their runway, adding more features, or starting additional projects.
Scalability is more important than cost: UCSB and GigaOM registered growing companies with plans to grow from 5 to 50 developers in months, not years.
Emerging technology expertise: The projects, which are AI/ML enabled, involve blockchain, IoT, and Cloud-Native Architecture where India’s 75% AI adoption leads to profound talent pools.
Well-defined with the least amount of ambiguity: Well-specified, stable-scope, high-structured deliverables that breed less need for real-time coordination.
Long-term relationships vs single projects: Companies that want to invest in dedicated teams for continuous development, maintenance, and continuous improvement where time-zone async becomes the norm.
Most sophisticated firms establish hybrid Australian-Indian structures:
Strategy and design in Australia (10-20% of budget): Local discovery, UX research, design systems, and technical architecture—based on Australian market knowledge and access to local stakeholders.
Implementation in India (50-70% of budget): Core development, API integration, backend architecture, testing—taking advantage of Indian cost efficiencies in bulk coding.
QA and deployment in Australia (10-20% of budget): Final testing, user acceptance, compliance checks, and go-live support—providing Australian supervision and finishing touches.
This model results in 30-45% savings compared to pure Australian development while delivering 80-90% of local quality and communication benefits.
1. Portfolio Verification: Scan 3-5 past projects that are close in complexity to your own (with live URLs and client references).
2. Technical Stack Assessment: Ensure experience in necessary technologies, skills in emerging technologies, and cloud solution knowledge.
3. Client References and Reviews: Reach out to 3 clients from the recent projects, review Clutch/GoodFirms ratings (aim for 4.5+), and browse detailed testimonials.
4. Communication Quality Testing: Evaluate your response time while under review (<24 hours), the clarity of English, and the technical ability to explain.
5. Process Maturity Validation: Validate Agile/Scrum maturity, CI/CD pipelines, code review standards, and QA procedures.
6. Transparency and Reporting: Ask for sample dashboards, standup cadence, and access to project management tooling.
7. Security and Compliance: Confirm ISO 27001/9001 certifications, GDPR/Privacy Act knowledge, NDA, and IP terms.
8. Team Structure Comprehension: Know the breakdown of personnel (dev, PM, QA, design), average tenure (goal 2+ years), and commitment model.
9. SLA and Support Commitments: Examine guarantees of response time, uptime, and support system after product launch.
10. Cultural Fit Phase: Assess work culture alignment, problem-solving mentality (proactive vs. reactive), and partner mentality.
For Australian agencies:
For Indian agencies:
Australian agencies excel at:
Indian agencies excel at:
Hybrid models excel at:
The Australia vs. India conversation isn’t one or the other—it’s pairing the business context with the best structure.
Opt for Australia when compliance, online teaming, and depth of knowledge of the Australian market warrant two to three times the charges.
Go with India, where 50-68% cost reduction and agile scalability meet with expertise in emerging tech to enable a longer runway, larger feature sets, or more products.
Go Hybrid When Whole Game’s Strategic Oversight and Cost Efficiency Are Domestic Benefits Are domestic benefits both important, capturing 30-45% savings while maintaining 80-90% local benefits?
The decision matrix indicates that India ranks higher than Australia, 8.3 to 8.1 overall—but different weightings for the factors lead to different results: when you prioritize communication, time zones, and legal over cost, the result flips.
For Australian companies in 2025, advanced sourcing will be a question of having a deep knowledge of both choices, going through vendors with a fine-toothed comb, and designing engagements to extract maximum value—whether that be local Australian agencies, premium Indian partners, or hybrid solutions that merge the best of both worlds.